| 2025-12-08 08:10:00+08:00 |
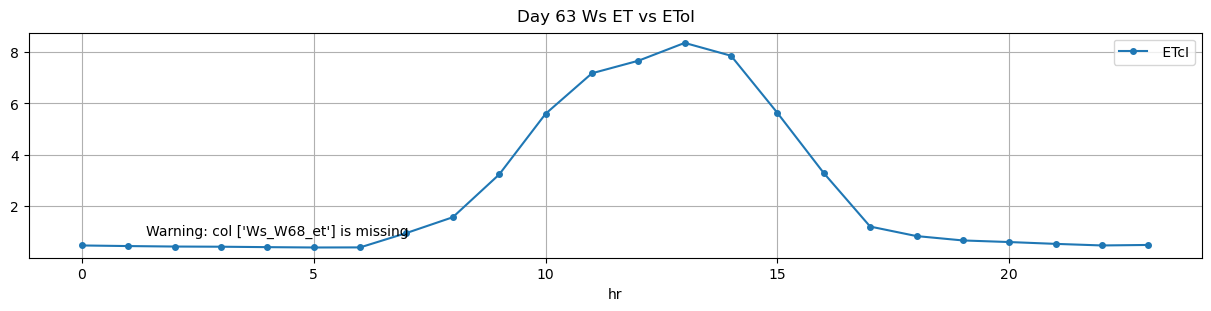
63 |
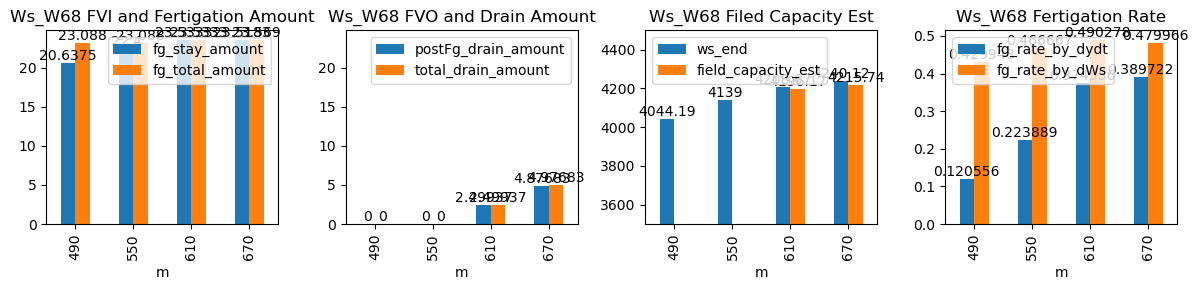
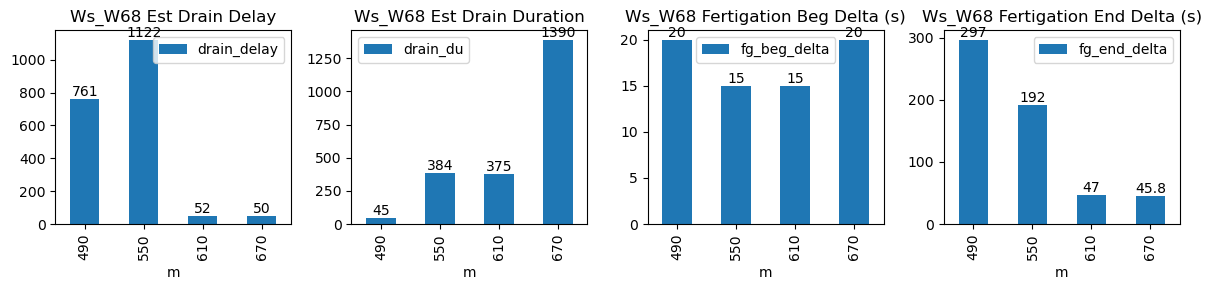
490 |
Ws_W68 |
0.363029 |
30 |
490.0 |
490.333333 |
490.80 |
495.750000 |
3941.000000 |
4044.187500 |
48 |
-0.017135 |
-0.003745 |
-0.030519 |
0.120556 |
0.429948 |
20.637500 |
True |
20.0 |
297.0 |
23.088000 |
0.0 |
0.000000 |
0.000000 |
45 |
761 |
-0.014120 |
NaN |
| 2025-12-08 09:10:00+08:00 |
63 |
550 |
Ws_W68 |
0.363029 |
30 |
550.0 |
550.250000 |
550.80 |
554.000000 |
4027.000000 |
4139.000000 |
48 |
-0.052370 |
-0.049568 |
-0.068410 |
0.223889 |
0.466667 |
22.400000 |
True |
15.0 |
192.0 |
23.088000 |
0.0 |
0.000000 |
0.000000 |
384 |
1122 |
-0.041905 |
NaN |
| 2025-12-08 10:10:00+08:00 |
63 |
610 |
Ws_W68 |
0.363029 |
30 |
610.0 |
610.250000 |
610.80 |
611.583333 |
4091.000000 |
4208.666667 |
48 |
-0.089676 |
-0.137531 |
-0.101512 |
0.374556 |
0.490278 |
23.533333 |
True |
15.0 |
47.0 |
23.533333 |
0.0 |
2.499370 |
2.499370 |
375 |
52 |
-0.073027 |
4196.169815 |
| 2025-12-08 11:10:00+08:00 |
63 |
670 |
Ws_W68 |
0.363029 |
30 |
670.0 |
670.333333 |
670.82 |
671.583333 |
4122.533333 |
4240.125000 |
49 |
-0.107280 |
-0.163014 |
-0.111327 |
0.389722 |
0.479966 |
23.518333 |
True |
20.0 |
45.8 |
23.569000 |
0.1 |
4.876832 |
4.976832 |
1390 |
50 |
-0.075066 |
4215.740838 |