| 2025-12-11 09:10:00+08:00 |
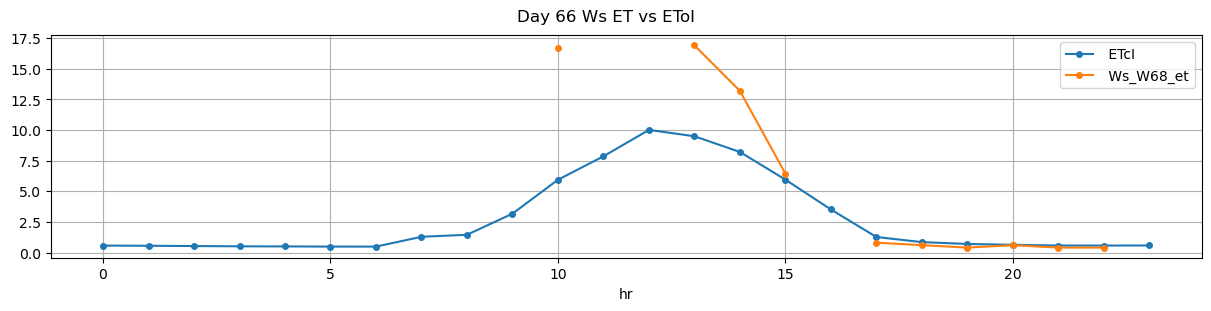
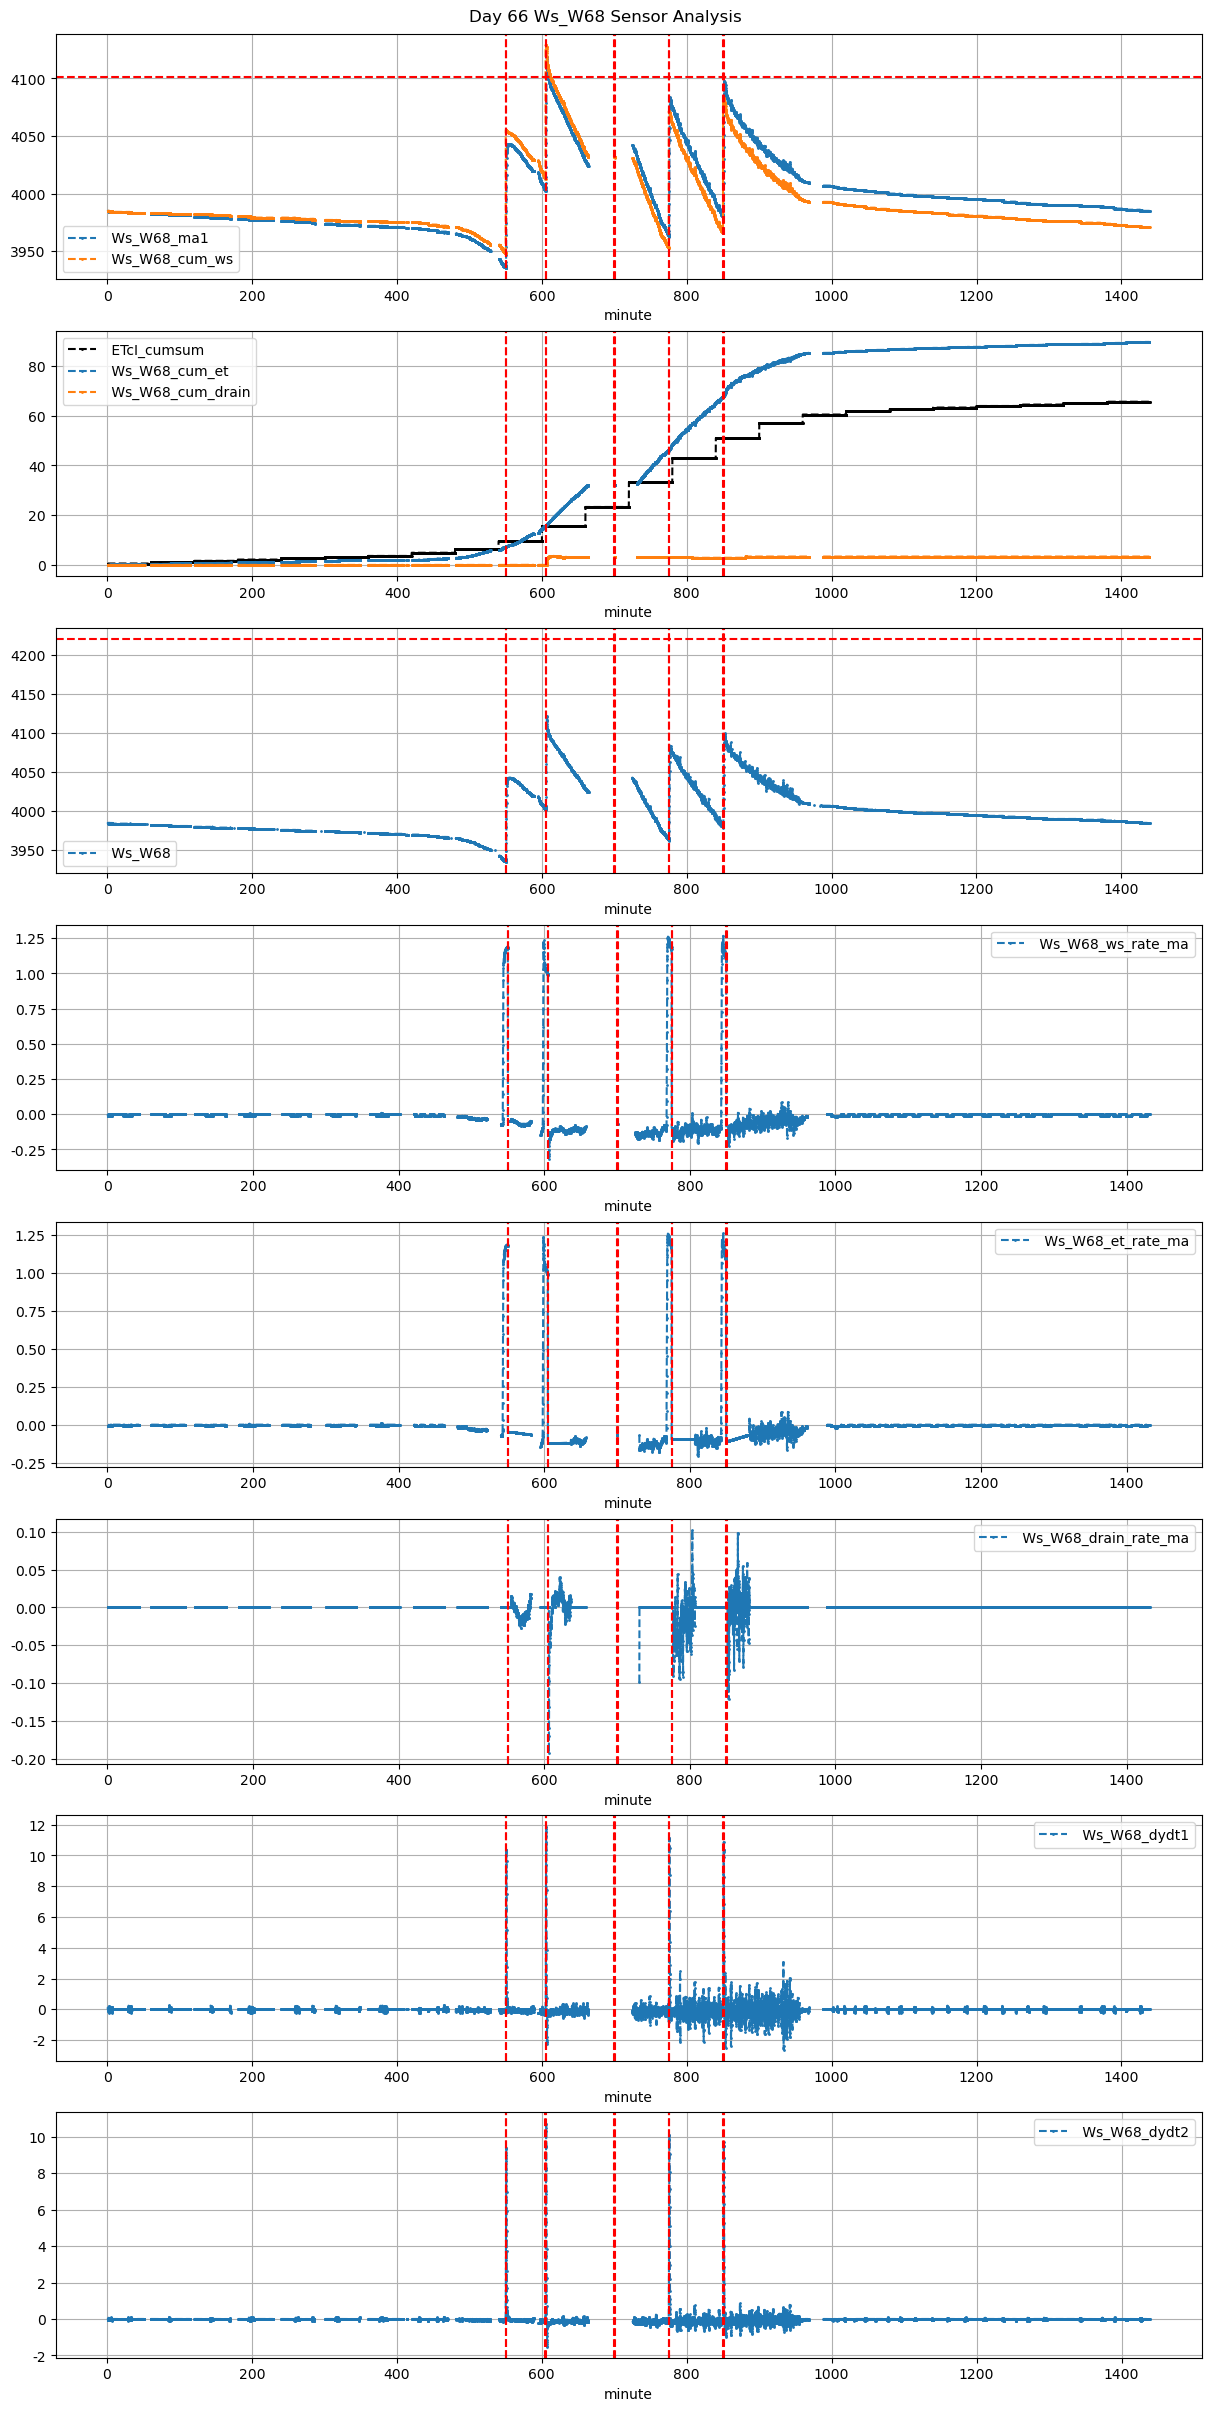
66 |
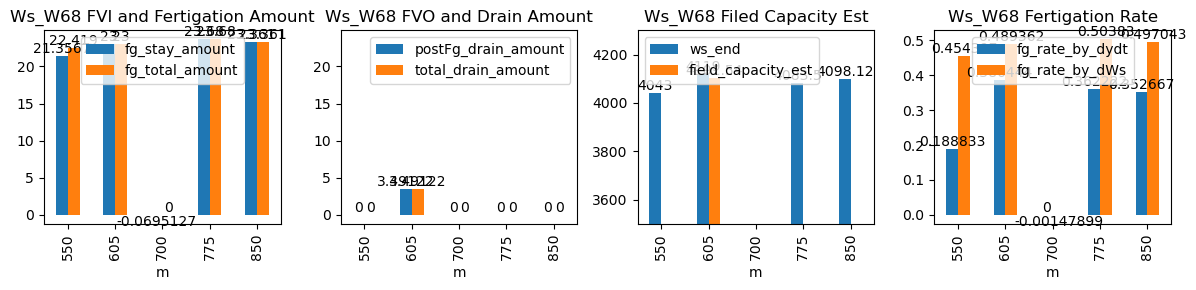
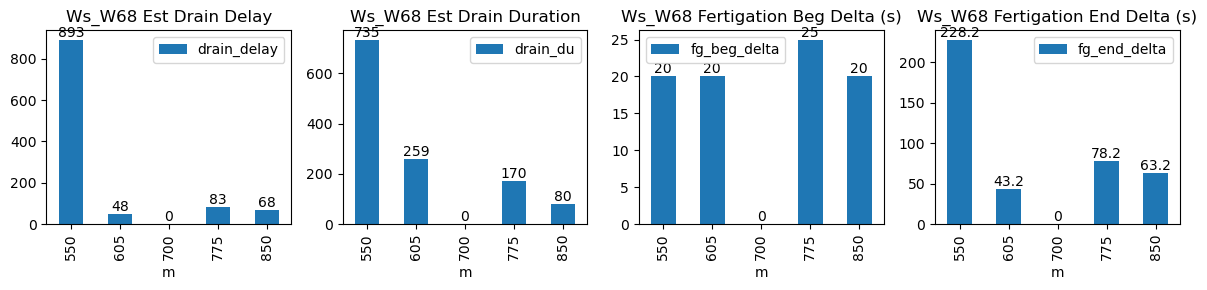
550 |
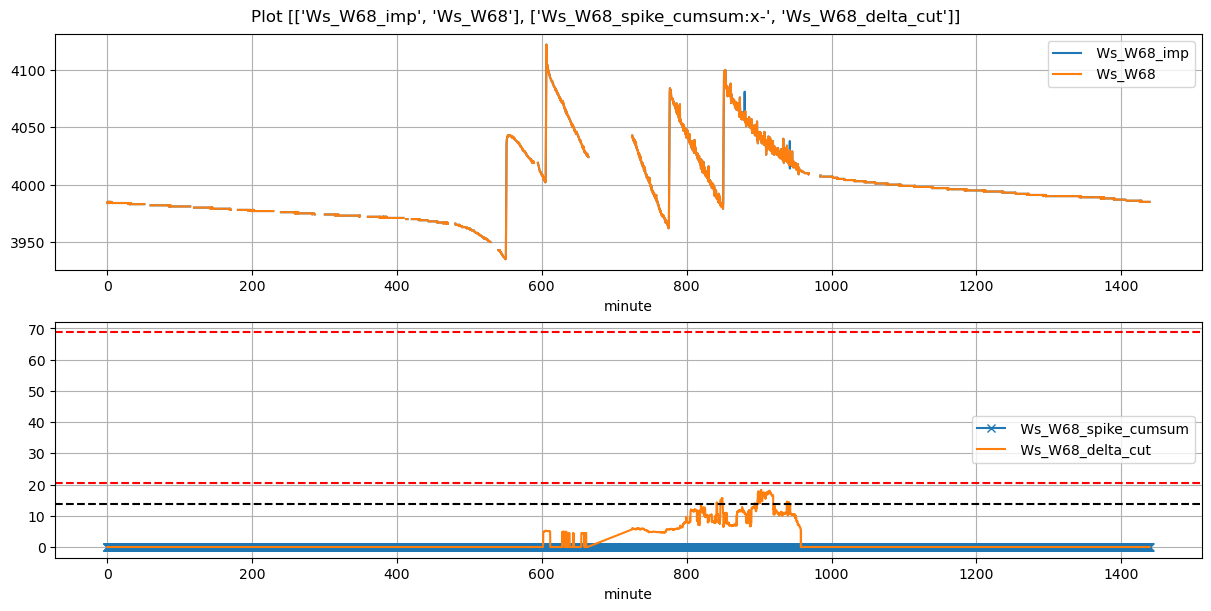
Ws_W68 |
0.459707 |
30 |
550.0 |
550.333333 |
550.78 |
554.583333 |
3936.216667 |
4043.000 |
47 |
-0.072989 |
-0.047654 |
-0.065309 |
0.188833 |
0.454397 |
21.356667 |
True |
20.0 |
228.2 |
22.419 |
0.0 |
0.00000 |
0.00000 |
735.0 |
893.0 |
-0.022071 |
NaN |
| 2025-12-11 10:05:00+08:00 |
66 |
605 |
Ws_W68 |
0.459707 |
30 |
605.0 |
605.333333 |
605.78 |
606.500000 |
4004.000000 |
4119.000 |
47 |
-0.124502 |
-0.144691 |
-0.118621 |
0.386444 |
0.489362 |
23.000000 |
True |
20.0 |
43.2 |
23.000 |
0.0 |
3.49122 |
3.49122 |
259.0 |
48.0 |
-0.074764 |
4101.543898 |
| 2025-12-11 11:40:00+08:00 |
66 |
700 |
Ws_W68 |
0.459707 |
30 |
700.0 |
NaN |
700.78 |
NaN |
NaN |
NaN |
47 |
-0.069513 |
NaN |
-0.069513 |
NaN |
-0.001479 |
-0.069513 |
False |
NaN |
NaN |
NaN |
NaN |
NaN |
NaN |
NaN |
NaN |
NaN |
NaN |
| 2025-12-11 12:55:00+08:00 |
66 |
775 |
Ws_W68 |
0.459707 |
30 |
775.0 |
775.416667 |
775.78 |
777.083333 |
3965.100000 |
4083.500 |
47 |
-0.097709 |
-0.141996 |
-0.097346 |
0.362222 |
0.503830 |
23.680000 |
True |
25.0 |
78.2 |
23.680 |
0.0 |
0.00000 |
0.00000 |
170.0 |
83.0 |
-0.070668 |
NaN |
| 2025-12-11 14:10:00+08:00 |
66 |
850 |
Ws_W68 |
0.459707 |
30 |
850.0 |
850.333333 |
850.78 |
851.833333 |
3981.320000 |
4098.125 |
47 |
-0.108453 |
-0.123642 |
-0.065363 |
0.352667 |
0.497043 |
23.361000 |
True |
20.0 |
63.2 |
23.361 |
0.0 |
0.00000 |
0.00000 |
80.0 |
68.0 |
-0.082442 |
NaN |