| 2025-12-21 11:35:00+08:00 |
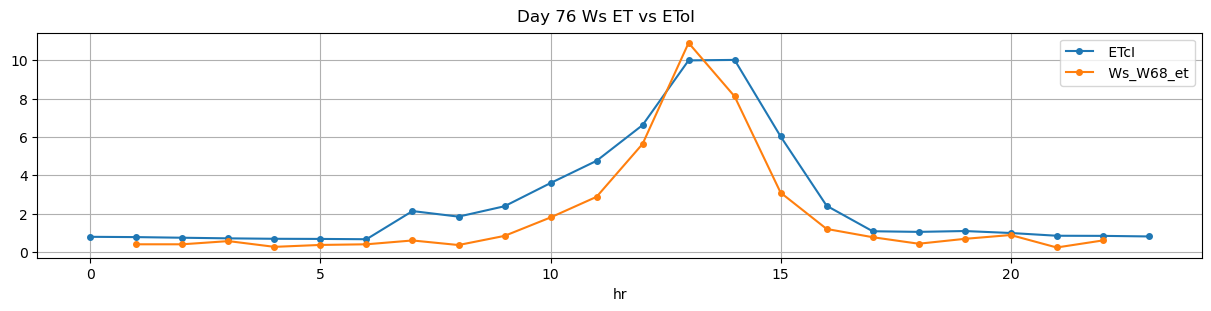
76 |
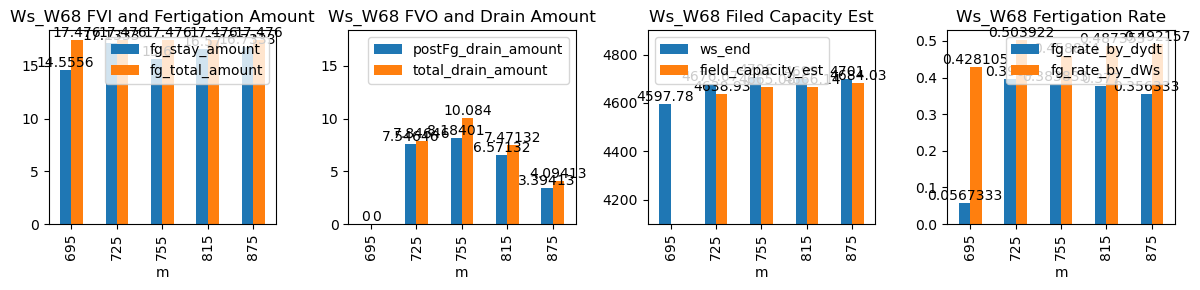
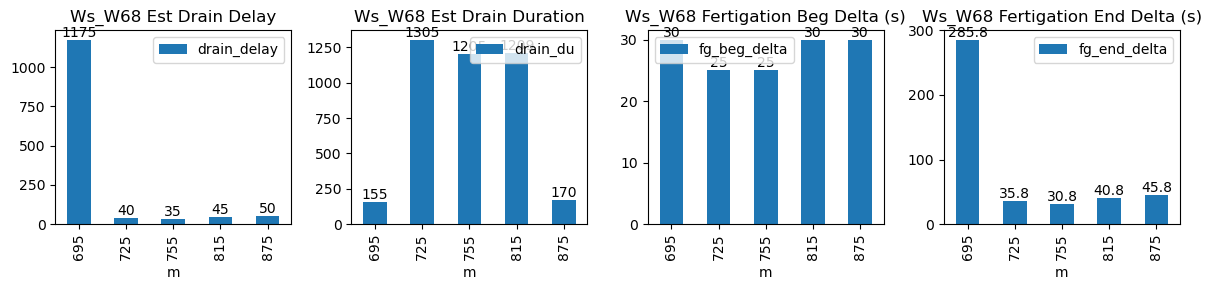
695 |
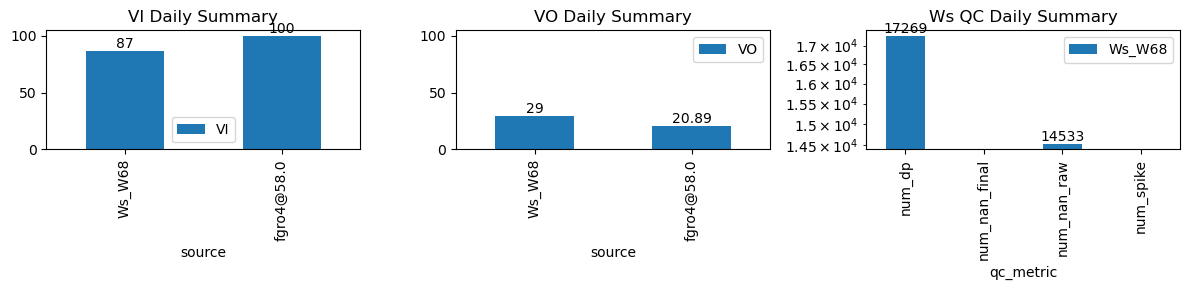
Ws_W68 |
0.813138 |
24.666667 |
695.0 |
695.500000 |
695.57 |
700.333333 |
4525.000000 |
4597.777778 |
34 |
-0.017197 |
-0.017356 |
0.000000 |
0.056733 |
0.428105 |
14.555556 |
True |
30.0 |
285.8 |
17.476 |
0.0 |
0.000000 |
0.000000 |
155 |
1175 |
-0.033260 |
NaN |
| 2025-12-21 12:05:00+08:00 |
76 |
725 |
Ws_W68 |
0.813138 |
28.833333 |
725.0 |
725.416667 |
725.57 |
726.166667 |
4591.000000 |
4676.666667 |
34 |
-0.045938 |
-0.123272 |
0.000000 |
0.396200 |
0.503922 |
17.133333 |
True |
25.0 |
35.8 |
17.476 |
0.3 |
7.546465 |
7.846465 |
1305 |
40 |
-0.139259 |
4638.934342 |
| 2025-12-21 12:35:00+08:00 |
76 |
755 |
Ws_W68 |
0.813138 |
30.000000 |
755.0 |
755.416667 |
755.57 |
756.083333 |
4628.000000 |
4706.000000 |
34 |
-0.069371 |
-0.136420 |
-0.056914 |
0.383833 |
0.458824 |
15.600000 |
True |
25.0 |
30.8 |
17.476 |
1.9 |
8.184010 |
10.084010 |
1205 |
35 |
-0.116993 |
4665.079952 |
| 2025-12-21 13:35:00+08:00 |
76 |
815 |
Ws_W68 |
0.813138 |
30.000000 |
815.0 |
815.500000 |
815.57 |
816.250000 |
4616.150000 |
4699.000000 |
34 |
-0.086517 |
-0.171696 |
-0.071317 |
0.377000 |
0.487353 |
16.570000 |
True |
30.0 |
40.8 |
17.476 |
0.9 |
6.571322 |
7.471322 |
1209 |
45 |
-0.090297 |
4666.143390 |
| 2025-12-21 14:35:00+08:00 |
76 |
875 |
Ws_W68 |
0.813138 |
30.000000 |
875.0 |
875.500000 |
875.57 |
876.333333 |
4617.333333 |
4701.000000 |
34 |
-0.059176 |
-0.079764 |
-0.035350 |
0.356333 |
0.492157 |
16.733333 |
True |
30.0 |
45.8 |
17.476 |
0.7 |
3.394130 |
4.094130 |
170 |
50 |
-0.054842 |
4684.029349 |