| 2025-12-23 10:10:00+08:00 |
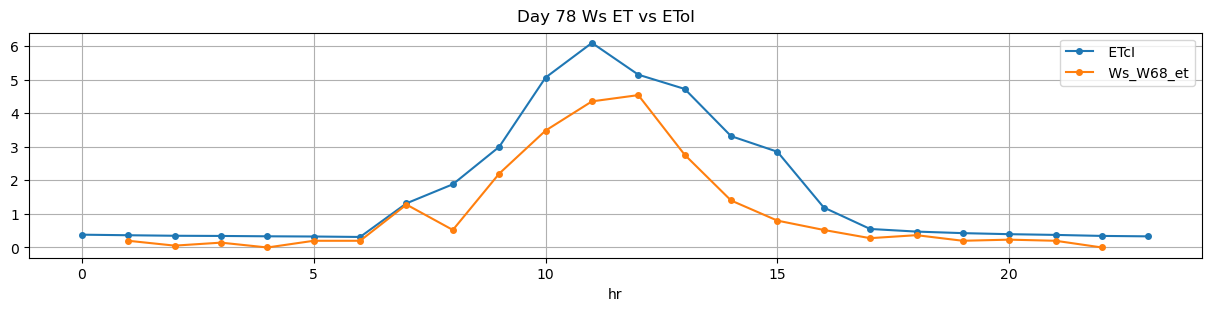
78 |
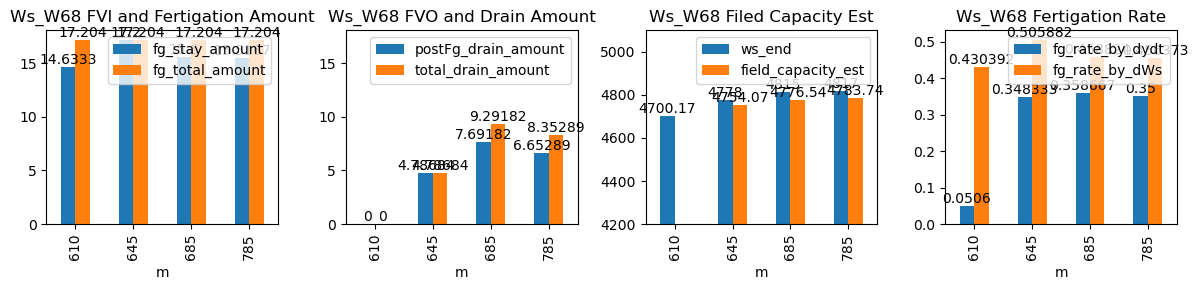
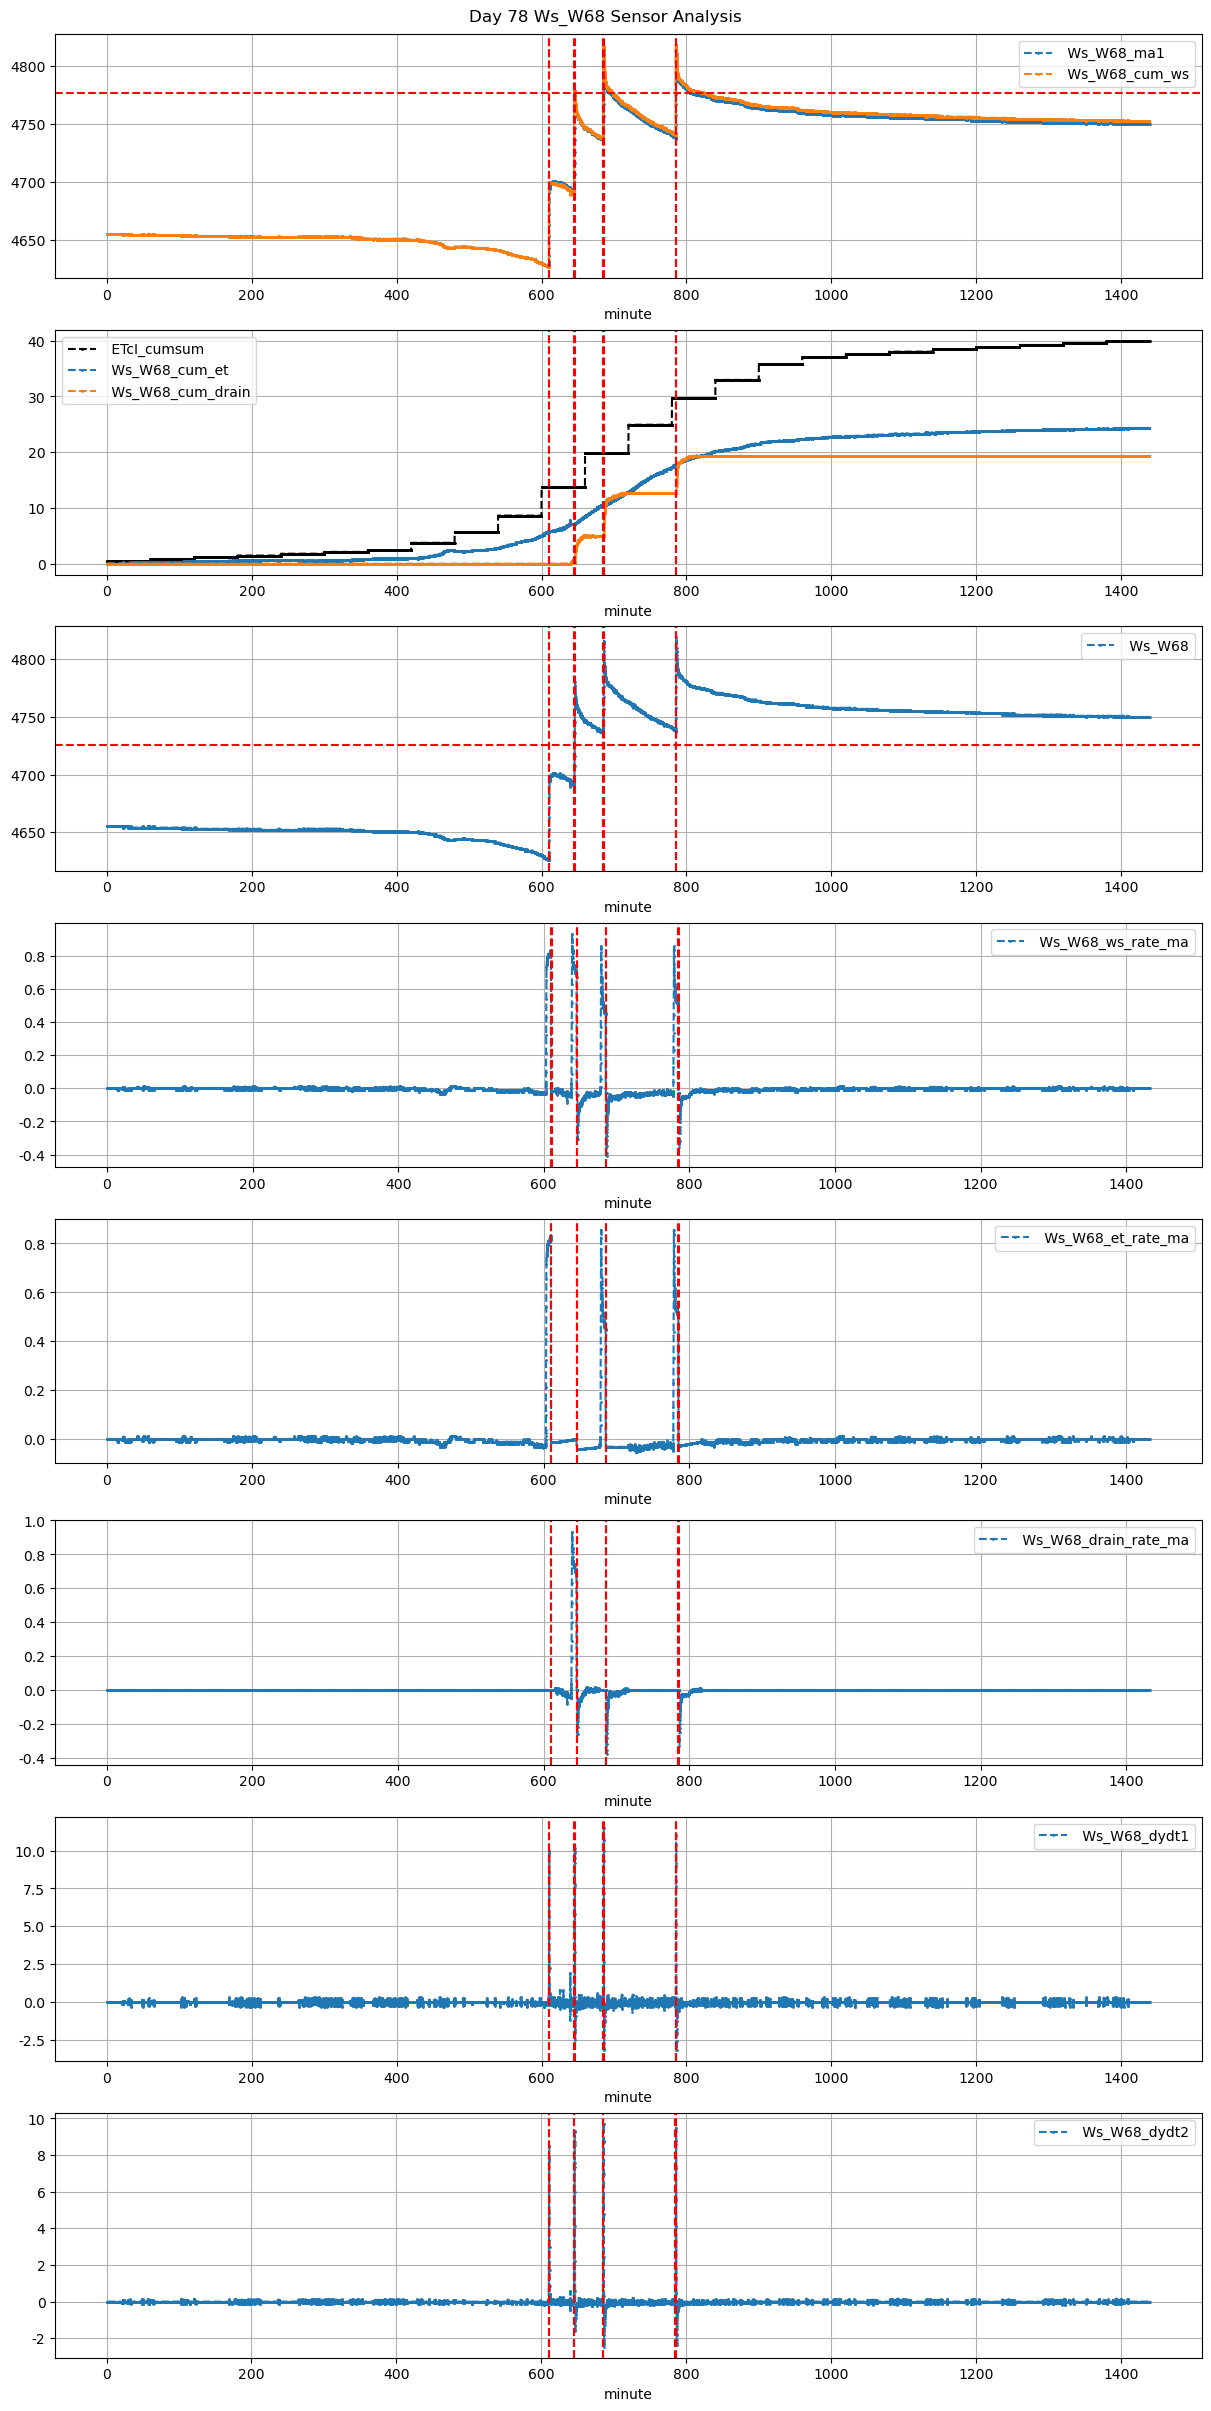
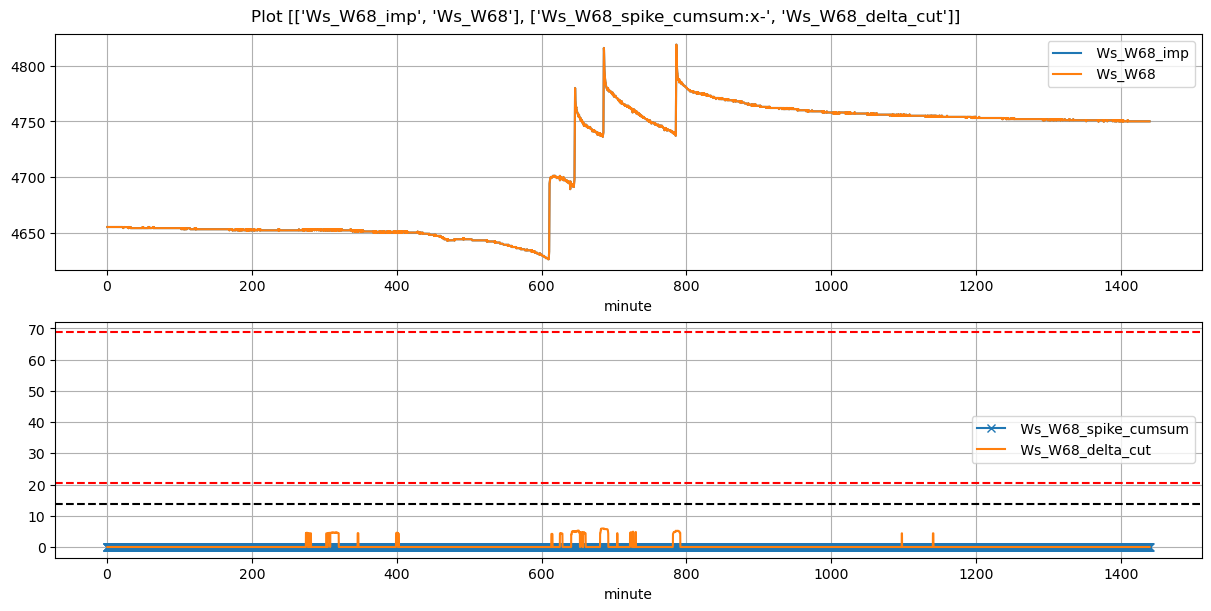
610 |
Ws_W68 |
0.41942 |
29.5 |
610.0 |
610.416667 |
610.57 |
615.500000 |
4627.000000 |
4700.166667 |
34 |
-0.029182 |
-0.013827 |
0.000000 |
0.050600 |
0.430392 |
14.633333 |
True |
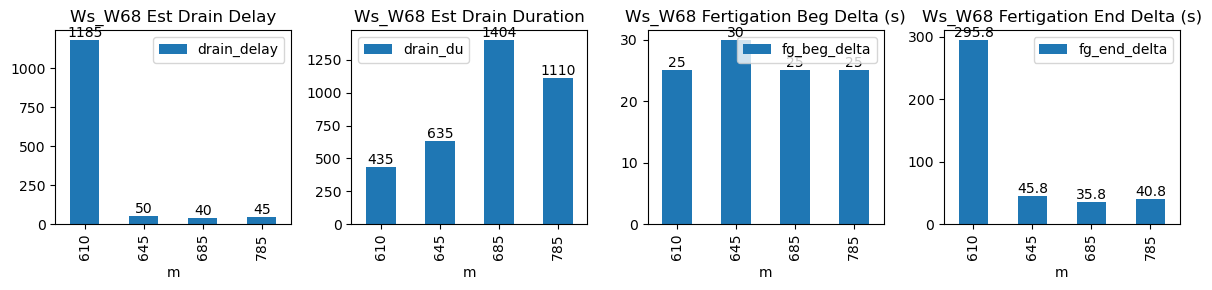
25.0 |
295.8 |
17.204 |
0.0 |
0.000000 |
0.000000 |
435 |
1185 |
-0.040028 |
NaN |
| 2025-12-23 10:45:00+08:00 |
78 |
645 |
Ws_W68 |
0.41942 |
30.0 |
645.0 |
645.500000 |
645.57 |
646.333333 |
4692.000000 |
4778.000000 |
34 |
-0.042308 |
-0.109753 |
-0.033316 |
0.348333 |
0.505882 |
17.200000 |
True |
30.0 |
45.8 |
17.204 |
0.0 |
4.786842 |
4.786842 |
635 |
50 |
-0.106774 |
4754.065789 |
| 2025-12-23 11:25:00+08:00 |
78 |
685 |
Ws_W68 |
0.41942 |
30.0 |
685.0 |
685.416667 |
685.57 |
686.166667 |
4737.000000 |
4815.000000 |
34 |
-0.031346 |
-0.102642 |
-0.032407 |
0.358667 |
0.458824 |
15.600000 |
True |
25.0 |
35.8 |
17.204 |
1.6 |
7.691816 |
9.291816 |
1404 |
40 |
-0.113050 |
4776.540921 |
| 2025-12-23 13:05:00+08:00 |
78 |
785 |
Ws_W68 |
0.41942 |
30.0 |
785.0 |
785.416667 |
785.57 |
786.250000 |
4739.416667 |
4817.000000 |
34 |
-0.027353 |
-0.086414 |
-0.011337 |
0.350000 |
0.456373 |
15.516667 |
True |
25.0 |
40.8 |
17.204 |
1.7 |
6.652890 |
8.352890 |
1110 |
45 |
-0.100476 |
4783.735548 |