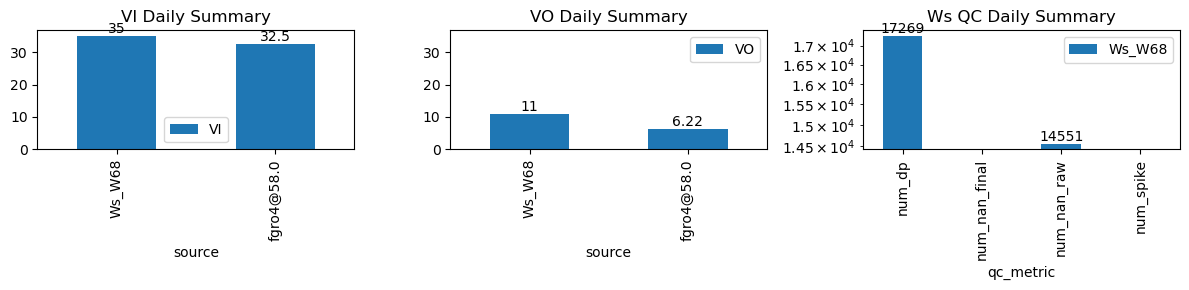
VI and VO Daily Summary
| ws_name | num_dp | num_nan_raw | num_nan_final | num_spike | cum_step_adj |
|---|---|---|---|---|---|
| Ws_W68 | 17,269 | 14,551 | 0 | 0 | 0.00 |
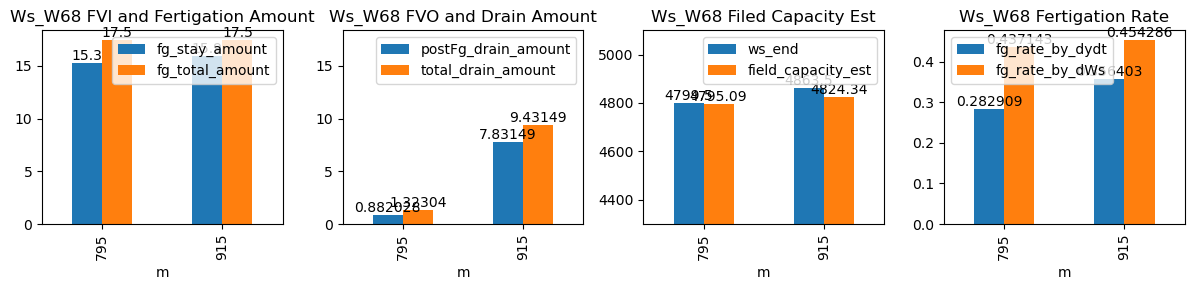
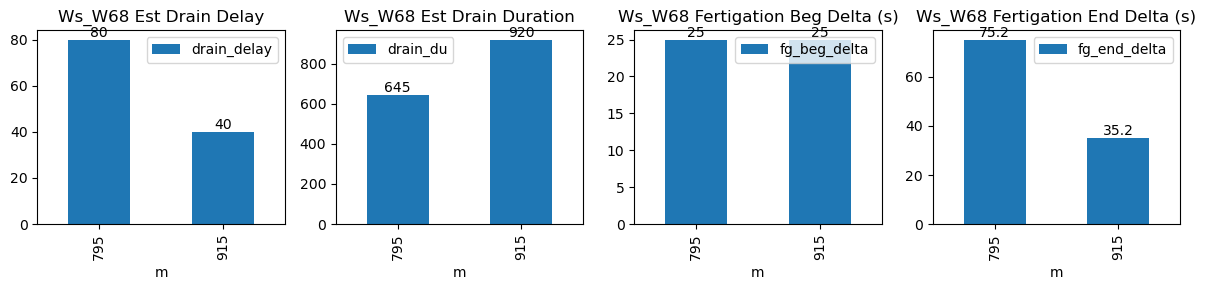
| ds | d | m | ws_name | prominence_cut | max_drain_du | fg_beg | fg_beg_est | fg_end | fg_end_est | ws_beg | ws_end | duc | pre_fg_et | post_fg_ws | post_drn_et | fg_rate_by_dydt | fg_rate_by_dWs | fg_stay_amount | enough_data | fg_beg_delta | fg_end_delta | fg_total_amount | fg_drain_amount | postFg_drain_amount | total_drain_amount | drain_du | drain_delay | drain_rate | field_capacity_est |
|---|---|---|---|---|---|---|---|---|---|---|---|---|---|---|---|---|---|---|---|---|---|---|---|---|---|---|---|---|---|
| 2025-12-24 13:15:00+08:00 | 79 | 795 | Ws_W68 | 0.303837 | 30 | 795.0 | 795.416667 | 795.58 | 796.833333 | 4723.0 | 4799.5 | 35 | -0.007820 | -0.021173 | -0.011914 | 0.282909 | 0.437143 | 15.3 | True | 25.0 | 75.2 | 17.5 | 0.441014 | 0.882028 | 1.323042 | 645 | 80 | -0.014252 | 4795.089860 |
| 2025-12-24 15:15:00+08:00 | 79 | 915 | Ws_W68 | 0.303837 | 30 | 915.0 | 915.416667 | 915.58 | 916.166667 | 4784.0 | 4863.5 | 35 | -0.008819 | -0.089865 | -0.012876 | 0.356403 | 0.454286 | 15.9 | True | 25.0 | 35.2 | 17.5 | 1.600000 | 7.831493 | 9.431493 | 920 | 40 | -0.135742 | 4824.342533 |