VI and VO Daily Summary
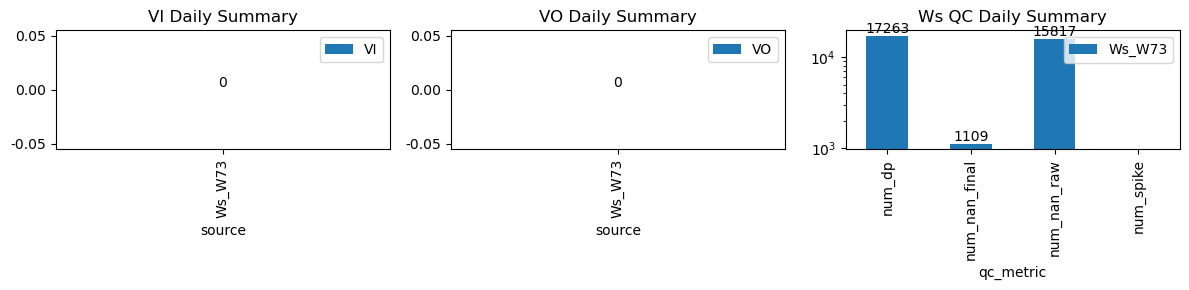
| ws_name | num_dp | num_nan_raw | num_nan_final | num_spike | cum_step_adj |
|---|---|---|---|---|---|
| Ws_W73 | 17,263 | 15,817 | 1,109 | 0 | 0.00 |
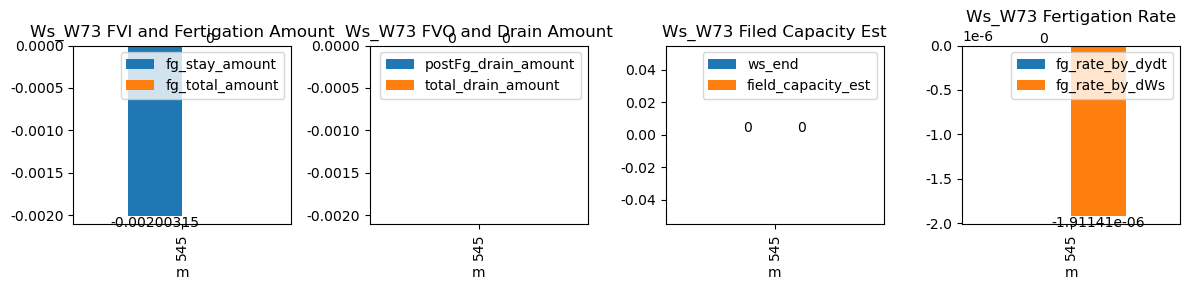
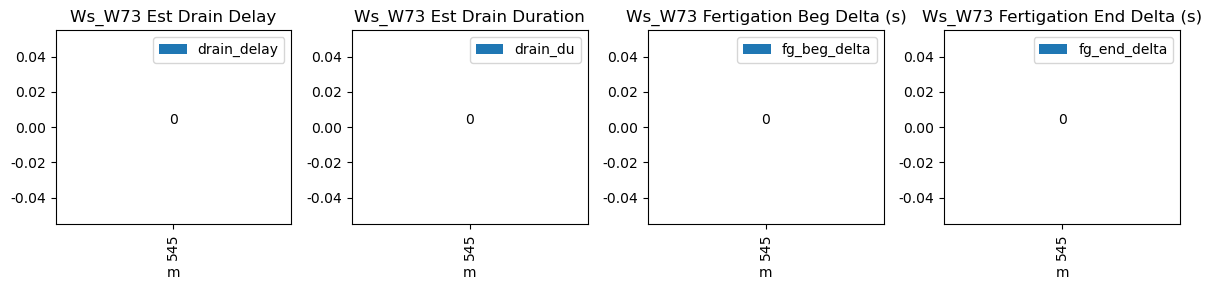
| ds | d | m | ws_name | prominence_cut | max_drain_du | fg_beg | fg_beg_est | fg_end | fg_end_est | ws_beg | ws_end | duc | pre_fg_et | post_fg_ws | post_drn_et | fg_rate_by_dydt | fg_rate_by_dWs | fg_stay_amount | enough_data | fg_beg_delta | fg_end_delta | fg_total_amount | fg_drain_amount | postFg_drain_amount | total_drain_amount | drain_du | drain_delay | drain_rate | field_capacity_est |
|---|---|---|---|---|---|---|---|---|---|---|---|---|---|---|---|---|---|---|---|---|---|---|---|---|---|---|---|---|---|
| 2026-03-01 09:05:01+08:00 | 146 | 545 | Ws_W73 | 0.441084 | 30 | 545.02 | NaN | 562.49 | NaN | 5790.0 | NaN | 1048 | -0.002003 | NaN | -0.002003 | NaN | -0.000002 | -0.002003 | False | NaN | NaN | NaN | NaN | NaN | NaN | NaN | NaN | NaN | NaN |