| 2026-03-02 08:50:01+08:00 |
147 |
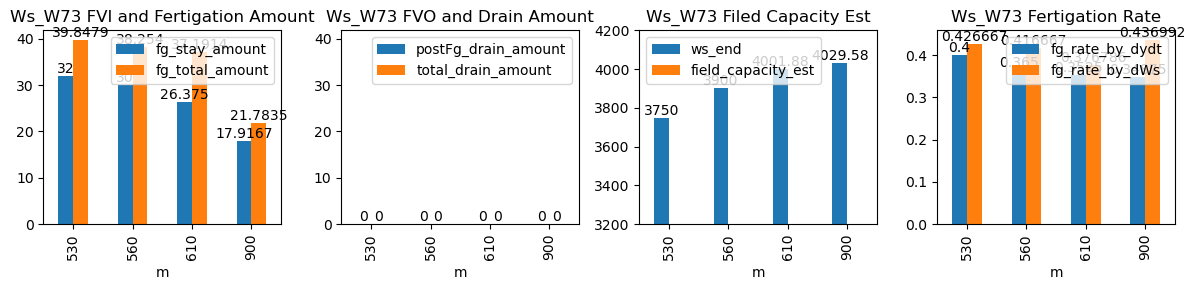
530 |
Ws_W73 |
2.928086 |
28.666667 |
530.02 |
529.916667 |
531.27 |
531.333333 |
3590.0 |
3750.0 |
75 |
0.000000 |
0.000000 |
0.000000 |
0.400000 |
0.426667 |
32.0 |
True |
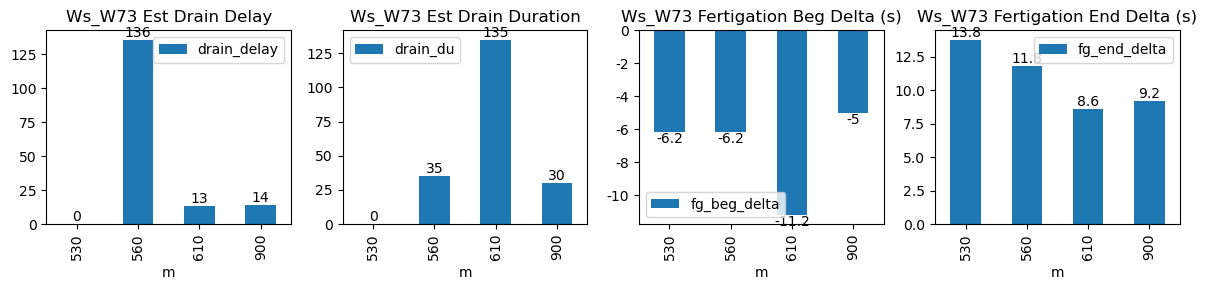
-6.2 |
3.8 |
38.555028 |
0.0 |
0 |
0.0 |
NaN |
NaN |
NaN |
NaN |
| 2026-03-02 09:20:01+08:00 |
147 |
560 |
Ws_W73 |
2.928086 |
30.000000 |
560.02 |
559.916667 |
561.22 |
561.250000 |
3750.0 |
3900.0 |
72 |
0.000000 |
-0.025000 |
-0.109722 |
0.367500 |
0.416667 |
30.0 |
True |
-6.2 |
1.8 |
37.012827 |
0.0 |
0 |
0.0 |
15.0 |
681.0 |
-1.437073 |
NaN |
| 2026-03-02 10:10:01+08:00 |
147 |
610 |
Ws_W73 |
2.928086 |
30.000000 |
610.02 |
609.833333 |
611.19 |
611.250000 |
3870.0 |
4010.0 |
70 |
-0.007087 |
-0.095833 |
0.000000 |
0.353750 |
0.400000 |
28.0 |
True |
-11.2 |
3.6 |
35.984693 |
0.0 |
0 |
0.0 |
24.0 |
18.0 |
-2.992958 |
NaN |
| 2026-03-02 15:00:00+08:00 |
147 |
900 |
Ws_W73 |
2.928086 |
30.000000 |
900.00 |
899.916667 |
900.68 |
900.666667 |
3940.0 |
4030.0 |
41 |
0.000000 |
-0.013889 |
0.000000 |
0.357708 |
0.439024 |
18.0 |
True |
-5.0 |
-0.8 |
21.076749 |
0.0 |
0 |
0.0 |
35.0 |
19.0 |
-1.041667 |
NaN |