VI and VO Daily Summary
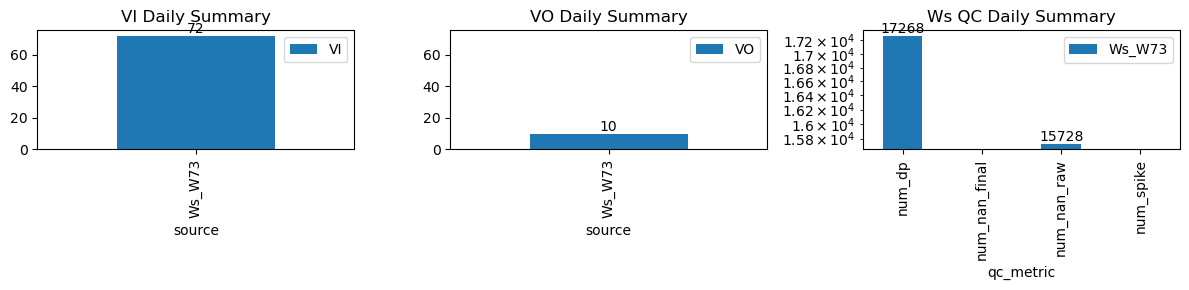
| ws_name | num_dp | num_nan_raw | num_nan_final | num_spike | cum_step_adj |
|---|---|---|---|---|---|
| Ws_W73 | 17,268 | 15,728 | 0 | 0 | 0.00 |
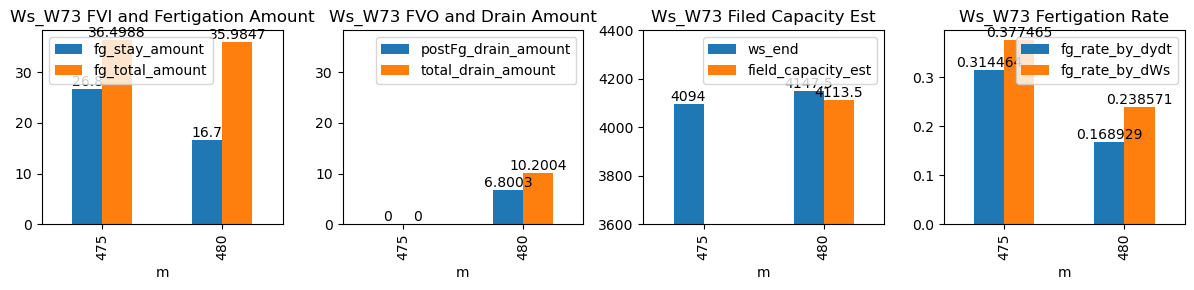
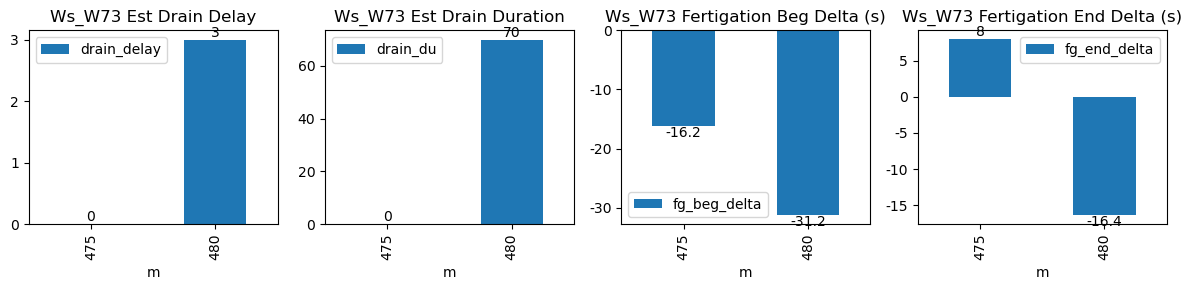
| ds | d | m | ws_name | prominence_cut | max_drain_du | fg_beg | fg_beg_est | fg_end | fg_end_est | ws_beg | ws_end | duc | pre_fg_et | post_fg_ws | post_drn_et | fg_rate_by_dydt | fg_rate_by_dWs | fg_stay_amount | enough_data | fg_beg_delta | fg_end_delta | fg_total_amount | fg_drain_amount | postFg_drain_amount | total_drain_amount | drain_du | drain_delay | drain_rate | field_capacity_est |
|---|---|---|---|---|---|---|---|---|---|---|---|---|---|---|---|---|---|---|---|---|---|---|---|---|---|---|---|---|---|
| 2026-03-03 07:55:01+08:00 | 148 | 475 | Ws_W73 | 0.436074 | 3.666667 | 475.02 | 474.75 | 476.20 | 476.333333 | 3960.0 | 4094.0 | 71 | 0.000000 | 0.000 | 0.0 | 0.314464 | 0.377465 | 26.8 | True | -16.2 | 8.0 | 36.498760 | 0.000000 | 0.000000 | 0.000000 | NaN | NaN | NaN | NaN |
| 2026-03-03 08:00:01+08:00 | 148 | 480 | Ws_W73 | 0.436074 | 30.000000 | 480.02 | 479.50 | 481.19 | 480.916667 | 4064.0 | 4147.5 | 70 | -0.001522 | -0.025 | 0.0 | 0.168929 | 0.238571 | 16.7 | True | -31.2 | -16.4 | 35.984693 | 3.400149 | 6.800297 | 10.200446 | 70.0 | 3.0 | -0.366078 | 4113.498513 |