| 2026-03-04 08:14:10+08:00 |
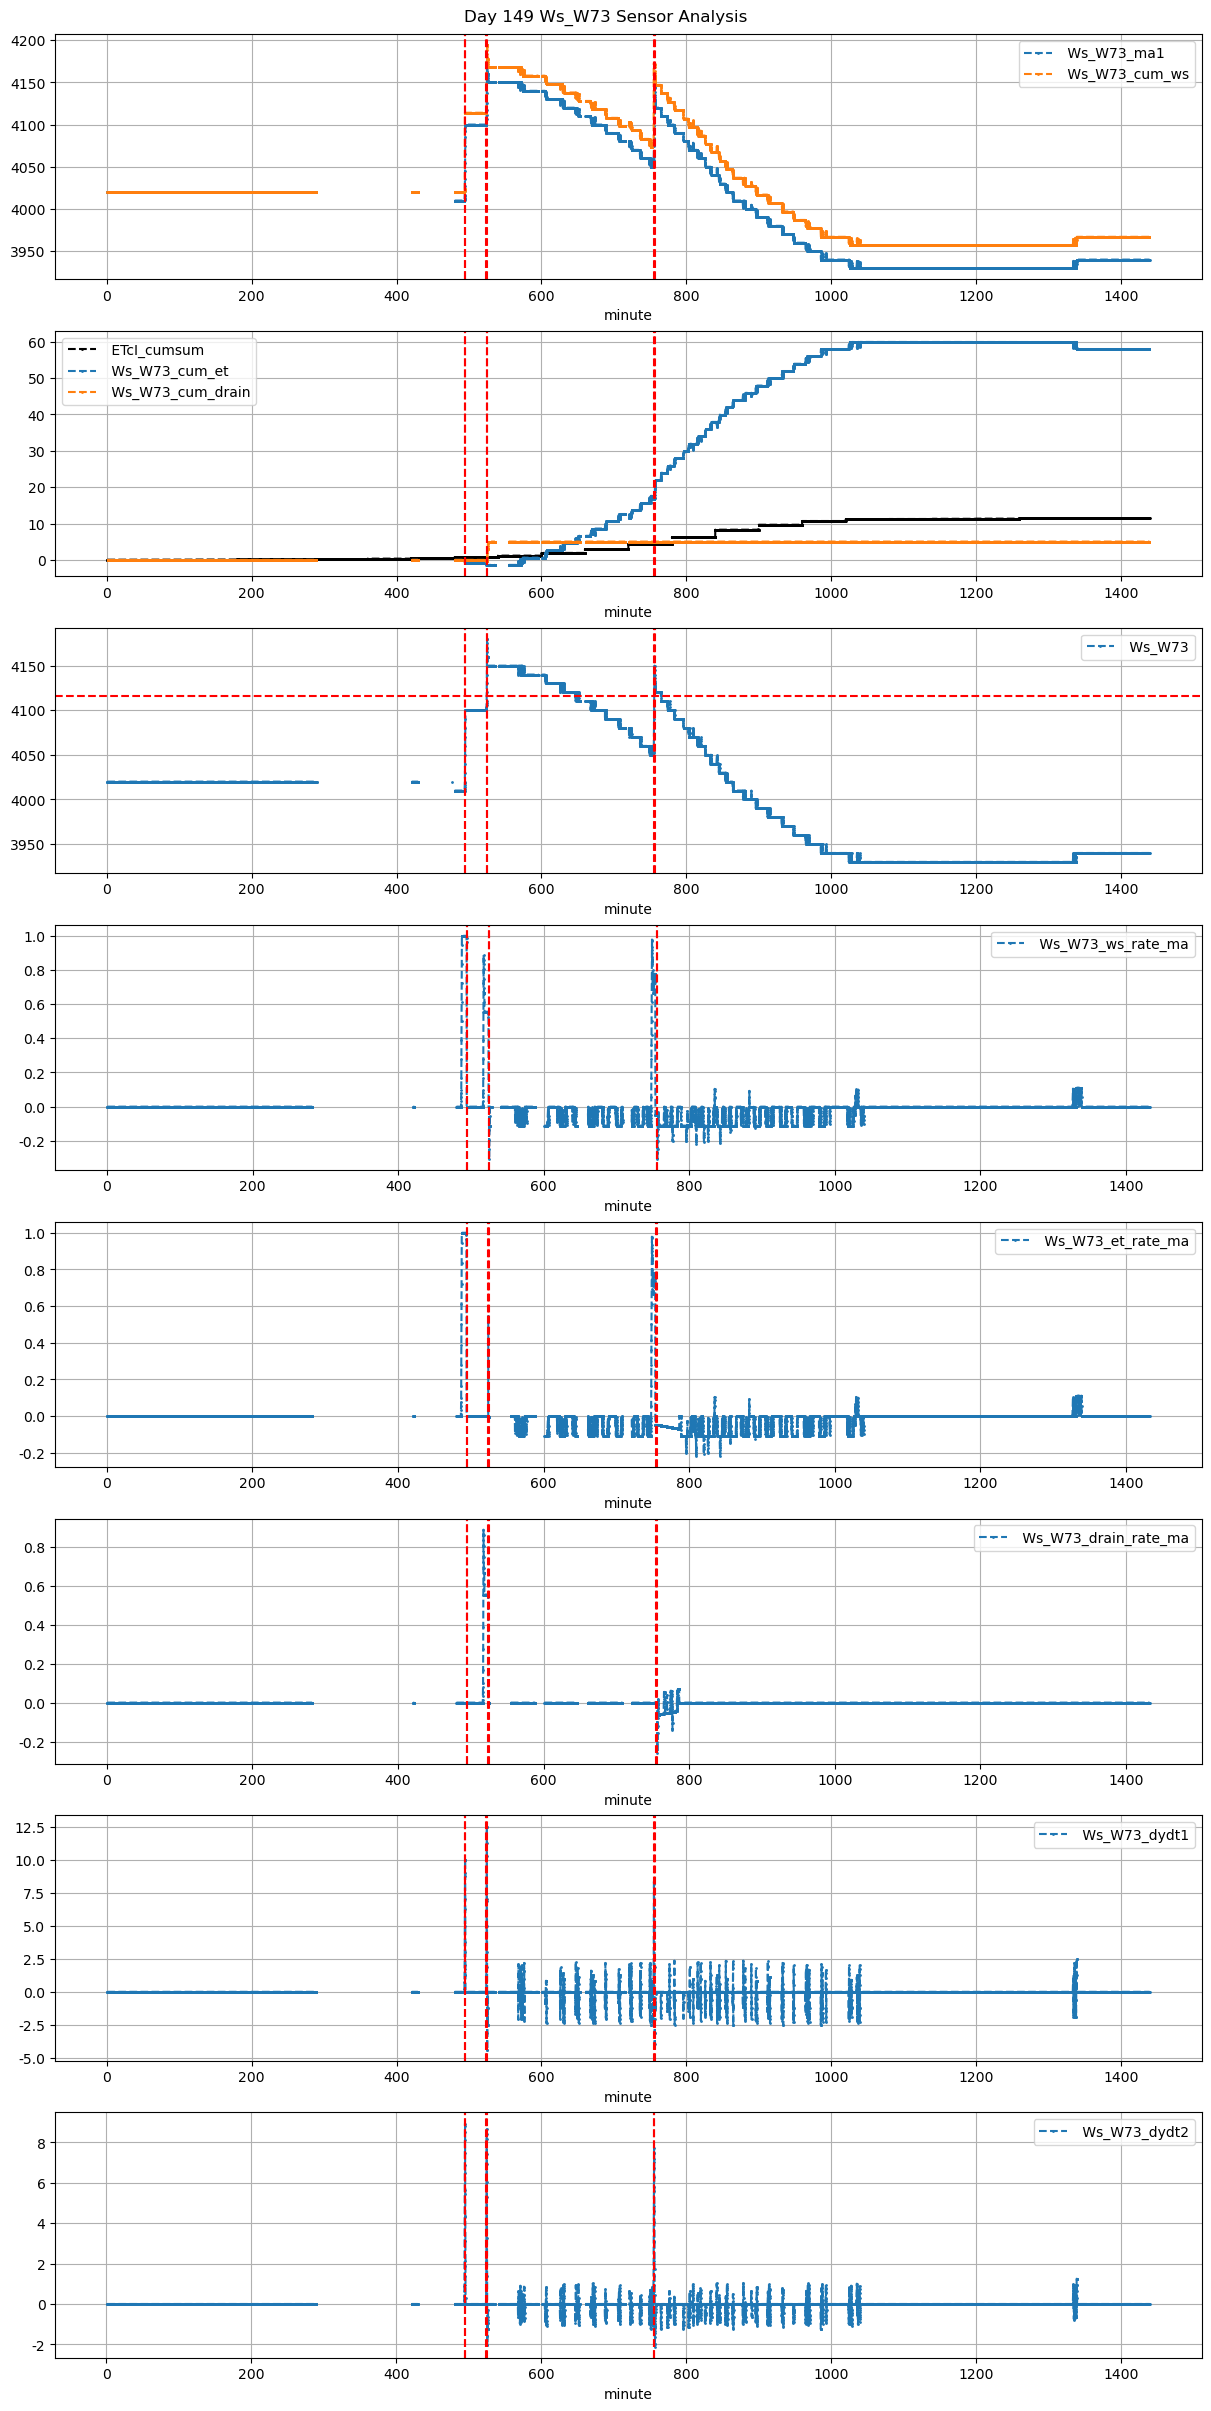
149 |
494 |
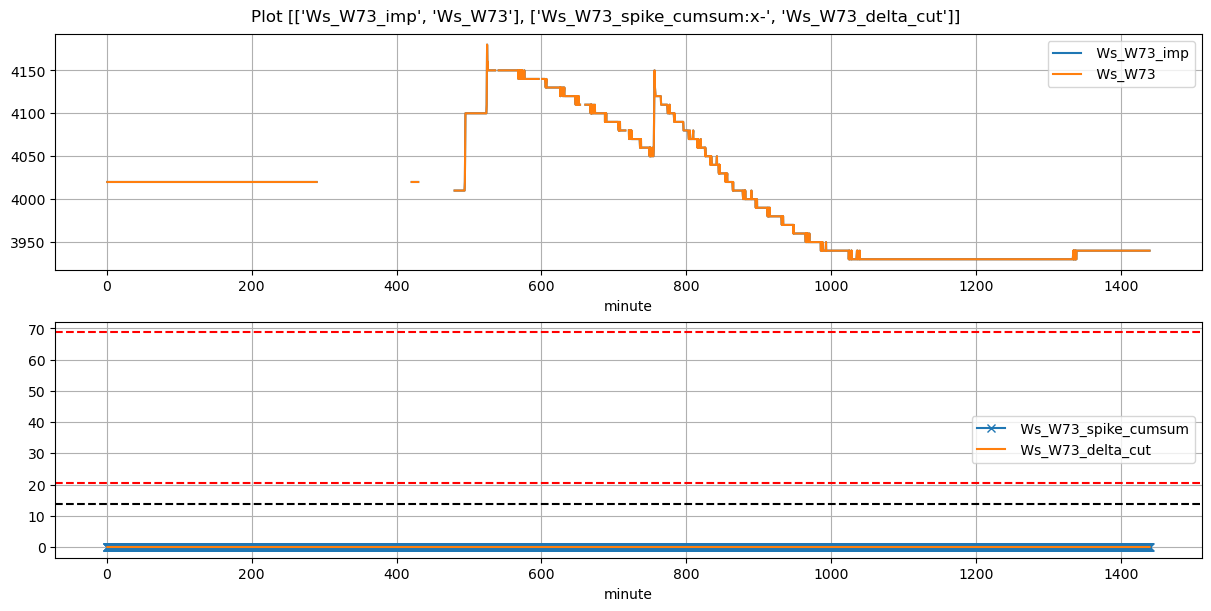
Ws_W73 |
0.836756 |
29.083333 |
494.17 |
494.083333 |
494.84 |
494.916667 |
4010.0 |
4100.0 |
40 |
0.000000 |
0.000000 |
0.000000 |
0.340000 |
0.450000 |
18.0 |
True |
-5.2 |
4.6 |
18.00 |
0.0 |
0.000000 |
0.000000 |
NaN |
NaN |
NaN |
NaN |
| 2026-03-04 08:44:10+08:00 |
149 |
524 |
Ws_W73 |
0.836756 |
30.000000 |
524.17 |
524.166667 |
524.84 |
524.833333 |
4100.0 |
4180.0 |
40 |
0.000000 |
-0.054167 |
0.000000 |
0.330750 |
0.400000 |
16.0 |
True |
-0.2 |
-0.4 |
16.88 |
0.0 |
0.000000 |
0.000000 |
24.0 |
14.0 |
-4.37500 |
NaN |
| 2026-03-04 12:35:01+08:00 |
149 |
755 |
Ws_W73 |
0.836756 |
30.000000 |
755.02 |
753.333333 |
756.19 |
756.166667 |
4050.0 |
4150.0 |
70 |
-0.108639 |
-0.083333 |
-0.072222 |
0.235417 |
0.285714 |
20.0 |
True |
-101.2 |
-1.4 |
29.54 |
0.0 |
5.401111 |
5.401111 |
79.0 |
8.0 |
-2.58064 |
NaN |