| 2026-03-06 08:25:00+08:00 |
151 |
505 |
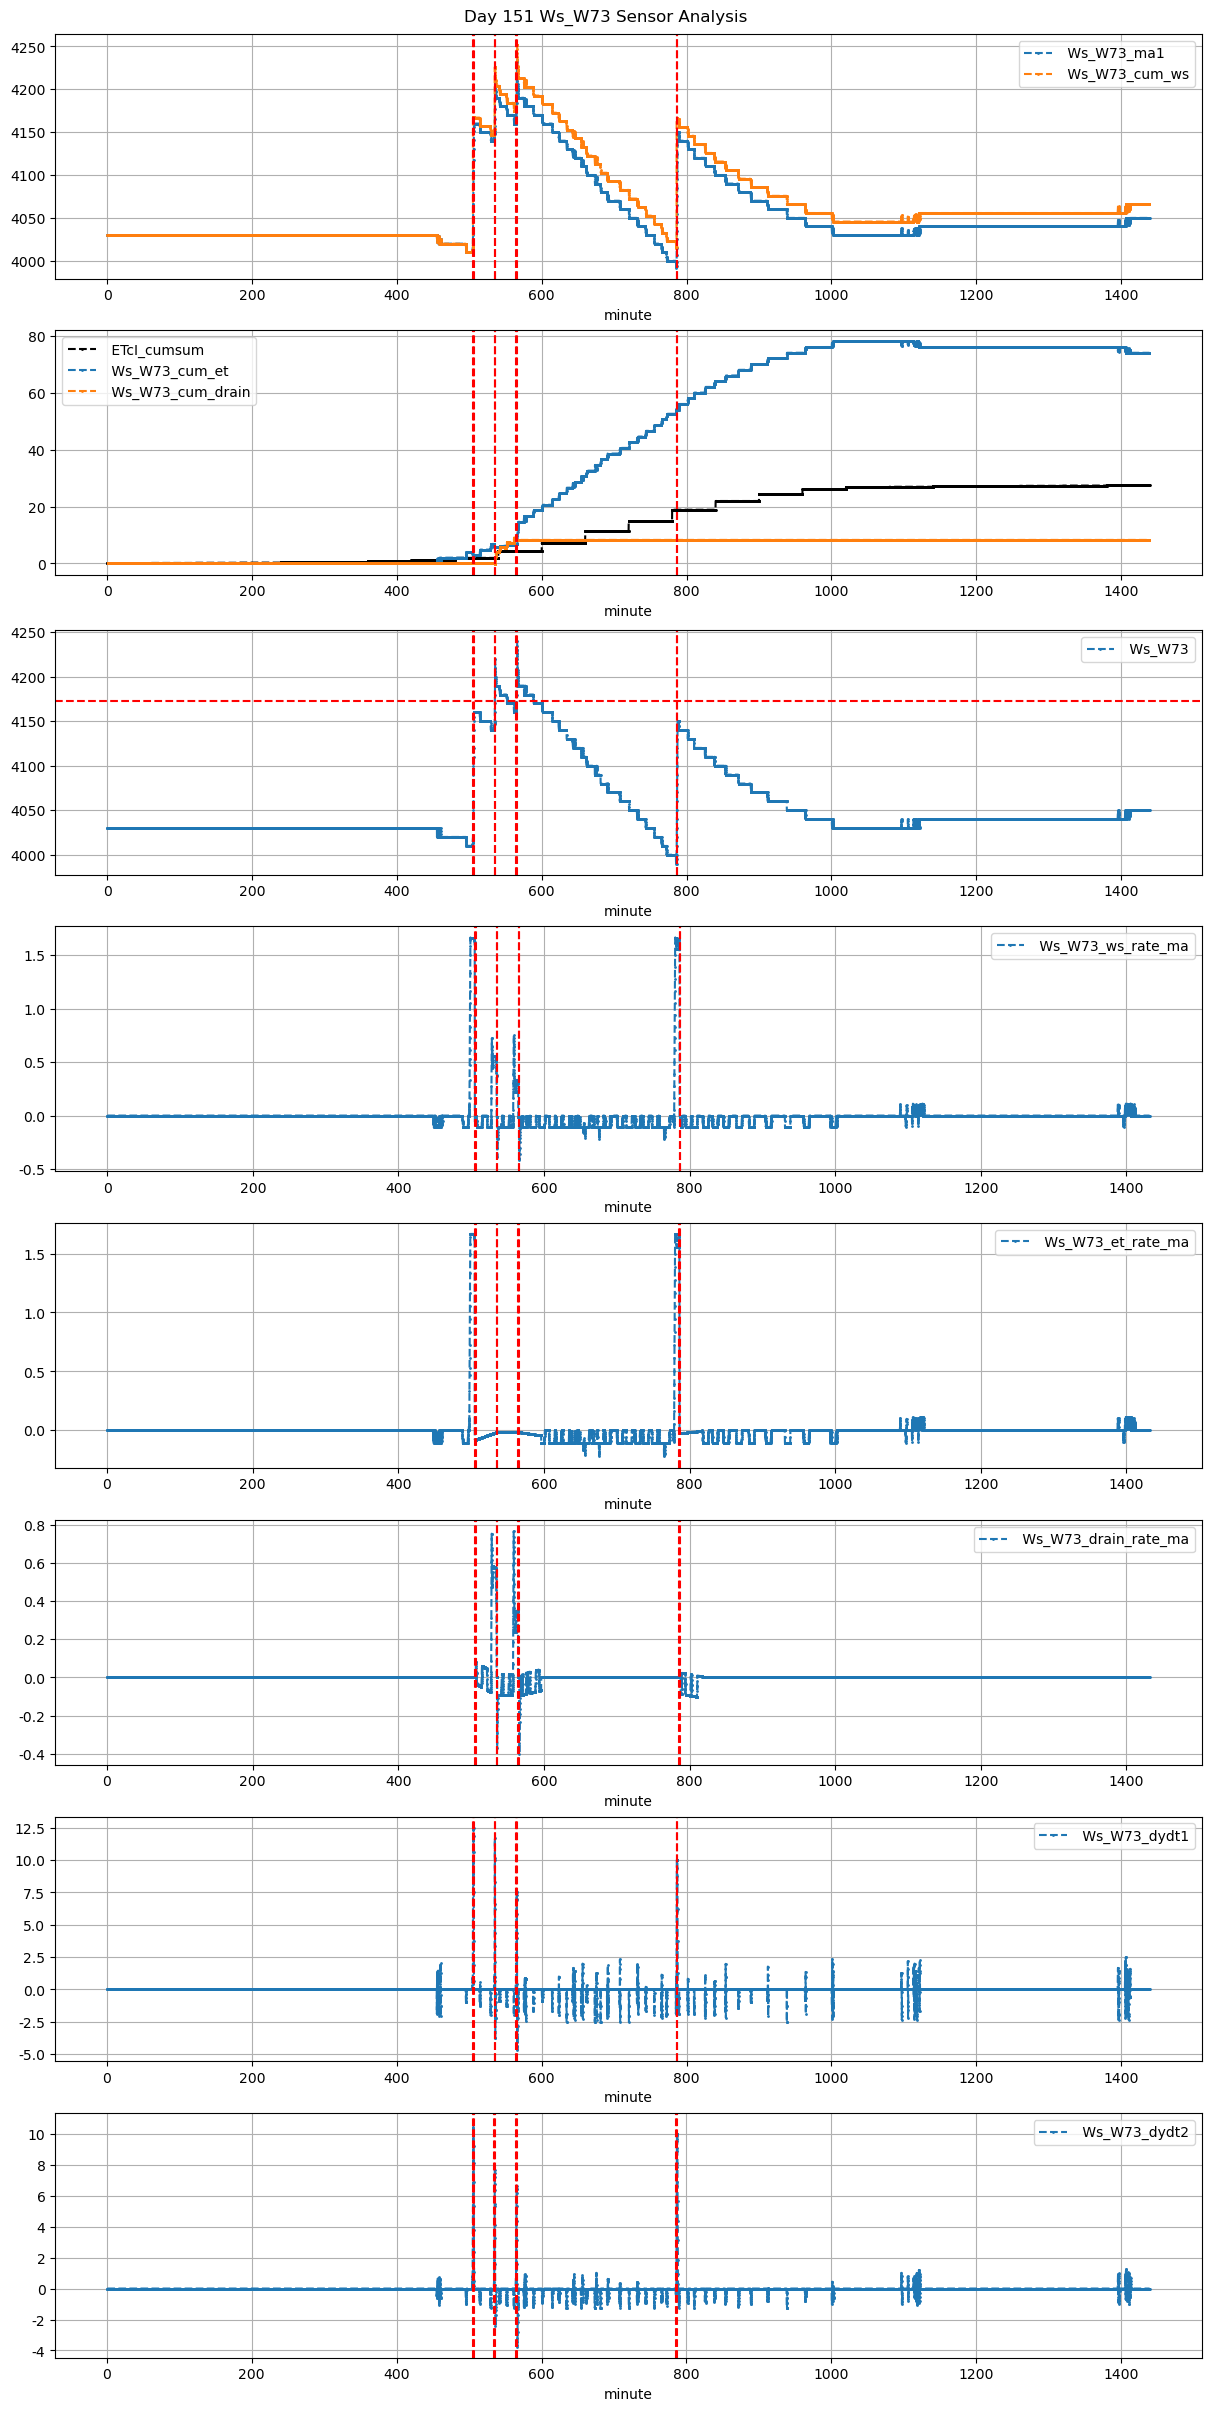
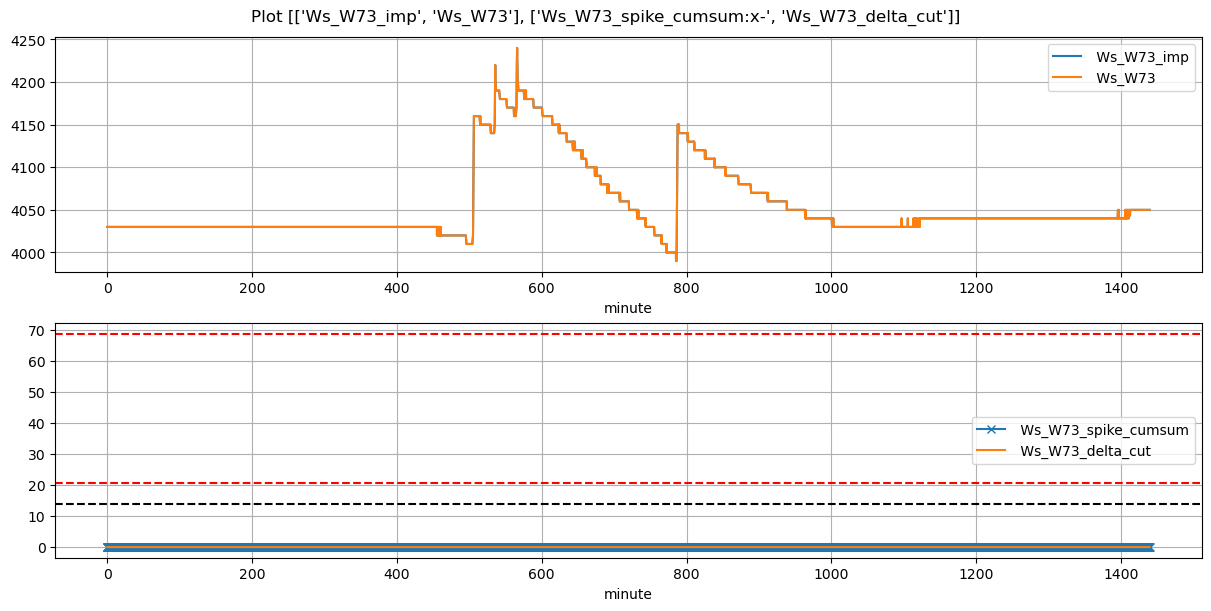
Ws_W73 |
2.036811 |
28.75 |
505.00 |
504.916667 |
506.20 |
506.25 |
4010.0 |
4160.0 |
72 |
-0.009373 |
-0.050694 |
0.000000 |
0.403750 |
0.416667 |
30.0 |
True |
-5.0 |
3.0 |
30.0 |
0.000000 |
0.000000 |
0.000000 |
30 |
1388 |
-1.635995 |
NaN |
| 2026-03-06 08:55:00+08:00 |
151 |
535 |
Ws_W73 |
2.036811 |
29.25 |
535.00 |
534.916667 |
535.67 |
535.75 |
4140.0 |
4220.0 |
40 |
-0.139266 |
-0.165278 |
0.000000 |
0.287500 |
0.400000 |
16.0 |
True |
-5.0 |
4.8 |
16.0 |
0.000000 |
0.000000 |
0.000000 |
50 |
14 |
-2.049245 |
NaN |
| 2026-03-06 09:25:01+08:00 |
151 |
565 |
Ws_W73 |
2.036811 |
30.00 |
565.02 |
564.583333 |
566.19 |
566.00 |
4160.0 |
4240.0 |
70 |
-0.102722 |
-0.094444 |
-0.015278 |
0.238712 |
0.228571 |
16.0 |
True |
-26.2 |
-11.4 |
28.0 |
3.903958 |
7.807917 |
11.711875 |
99 |
3 |
-4.140447 |
4200.960417 |
| 2026-03-06 13:06:12+08:00 |
151 |
786 |
Ws_W73 |
2.036811 |
30.00 |
786.20 |
786.166667 |
787.40 |
787.50 |
4000.0 |
4150.0 |
72 |
-0.016243 |
-0.063889 |
0.000000 |
0.400000 |
0.416667 |
30.0 |
True |
-2.0 |
6.0 |
30.0 |
0.000000 |
0.000000 |
0.000000 |
25 |
1380 |
-1.869616 |
NaN |