| 2026-03-07 08:08:40+08:00 |
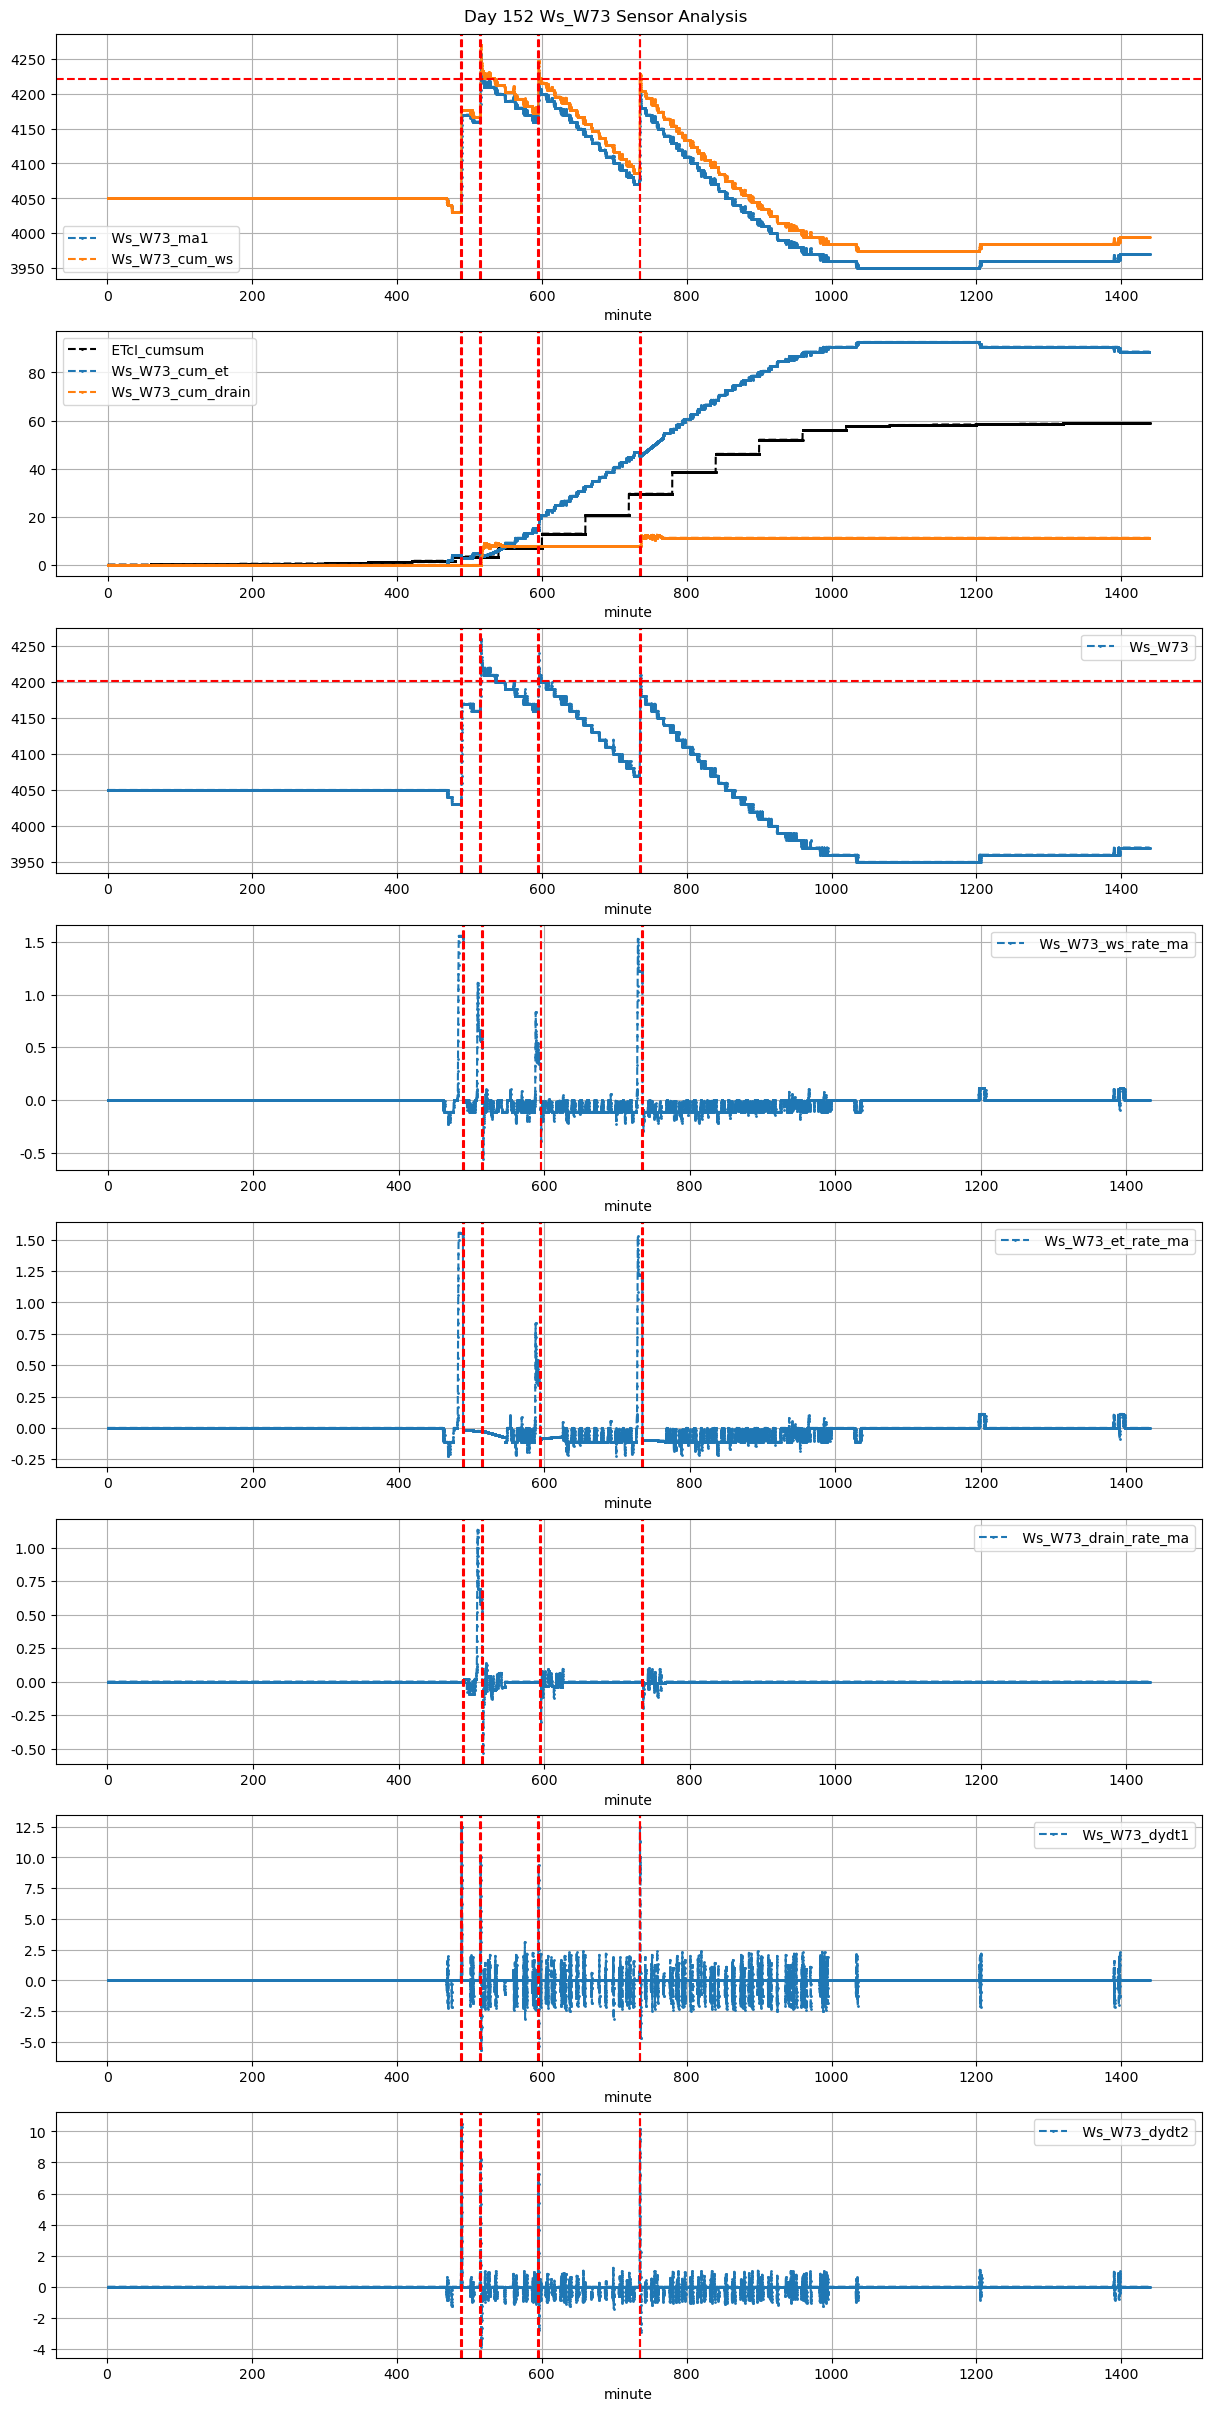
152 |
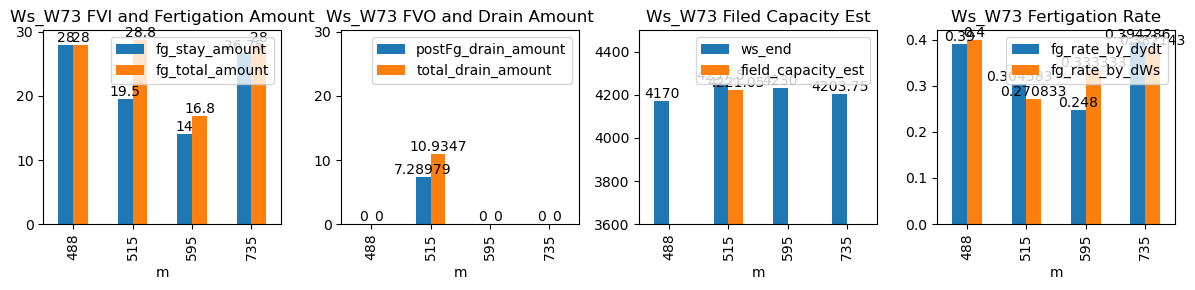
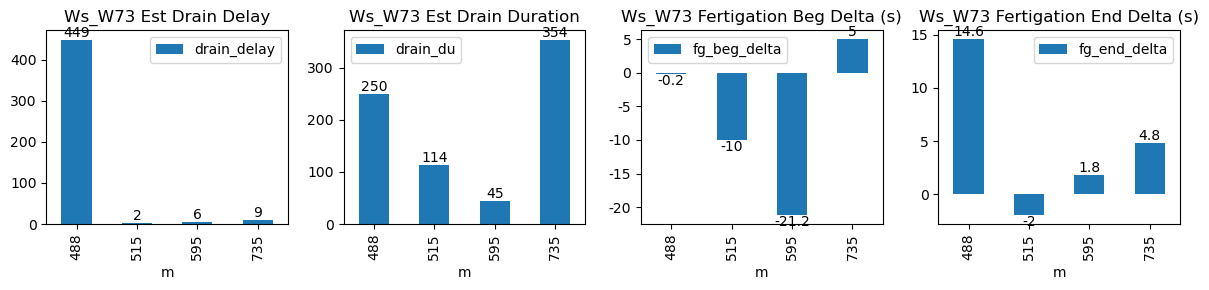
488 |
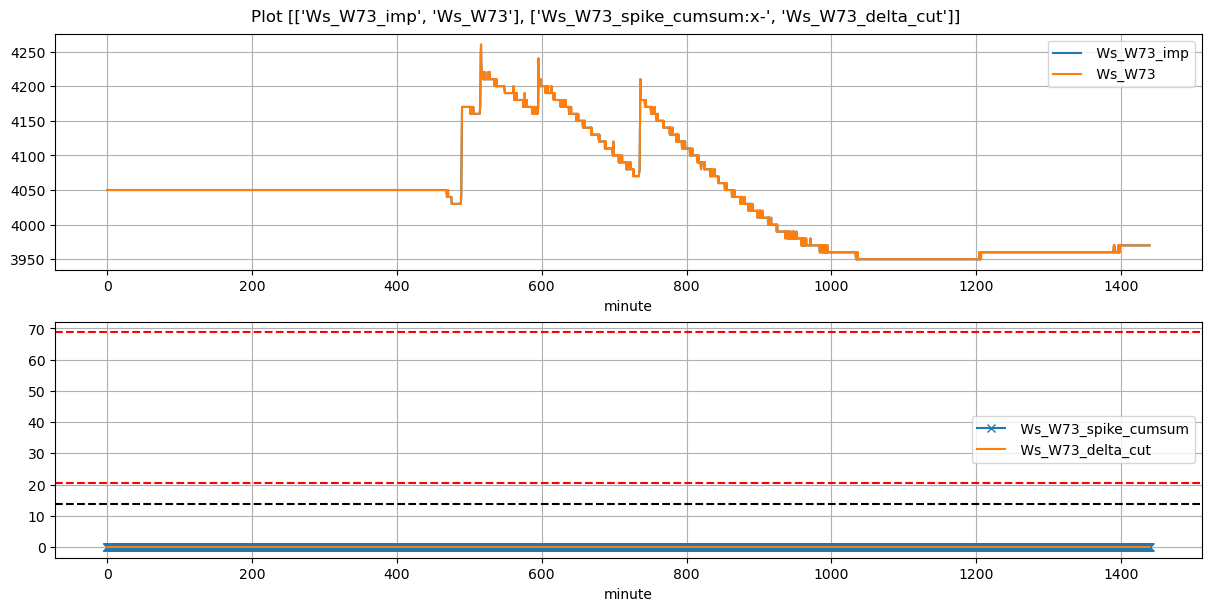
Ws_W73 |
1.93655 |
24.916667 |
488.67 |
488.666667 |
489.84 |
490.083333 |
4030.0 |
4170.00 |
70 |
-0.022160 |
-0.016667 |
0.000000 |
0.390000 |
0.400000 |
28.00 |
True |
-0.2 |
14.6 |
28.0 |
0.000000 |
0.000000 |
0.000000 |
250 |
449 |
-0.091925 |
NaN |
| 2026-03-07 08:35:00+08:00 |
152 |
515 |
Ws_W73 |
1.93655 |
30.000000 |
515.00 |
514.833333 |
516.20 |
516.166667 |
4160.0 |
4257.50 |
72 |
-0.024697 |
-0.058642 |
-0.074691 |
0.304583 |
0.270833 |
19.50 |
True |
-10.0 |
-2.0 |
28.8 |
3.644894 |
7.289789 |
10.934683 |
114 |
2 |
-0.125459 |
4221.051055 |
| 2026-03-07 09:55:01+08:00 |
152 |
595 |
Ws_W73 |
1.93655 |
30.000000 |
595.02 |
594.666667 |
595.72 |
595.750000 |
4160.0 |
4230.00 |
42 |
-0.084582 |
-0.092593 |
-0.067747 |
0.248000 |
0.333333 |
14.00 |
True |
-21.2 |
1.8 |
16.8 |
0.000000 |
0.000000 |
0.000000 |
45 |
6 |
-0.058776 |
NaN |
| 2026-03-07 12:15:00+08:00 |
152 |
735 |
Ws_W73 |
1.93655 |
30.000000 |
735.00 |
735.083333 |
736.17 |
736.250000 |
4070.0 |
4203.75 |
70 |
-0.097824 |
-0.115535 |
-0.101852 |
0.394286 |
0.382143 |
26.75 |
True |
5.0 |
4.8 |
28.0 |
0.000000 |
0.000000 |
0.000000 |
354 |
9 |
-0.059064 |
NaN |