| 2026-03-12 08:30:00+08:00 |
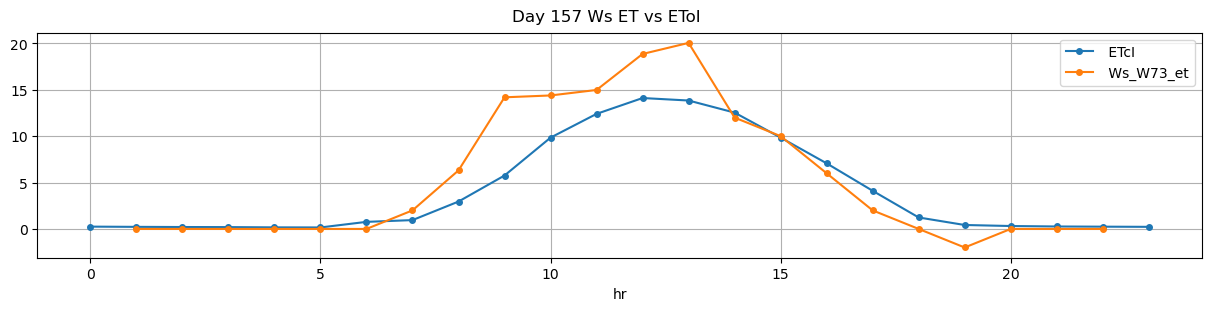
157 |
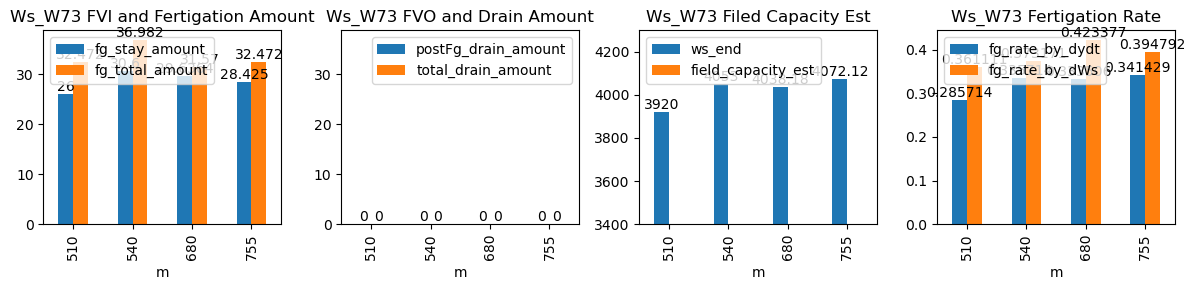
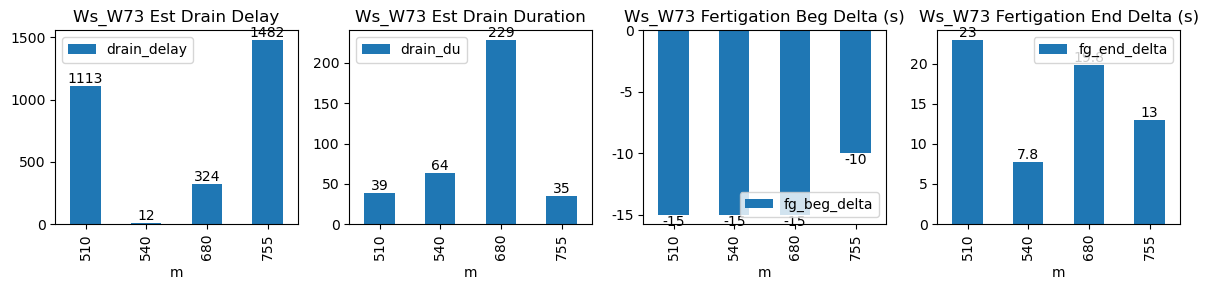
510 |
Ws_W73 |
1.195586 |
28.416667 |
510.0 |
509.750000 |
511.20 |
511.583333 |
3790.0 |
3920.000000 |
72 |
-0.060487 |
-0.060494 |
0.000000 |
0.285714 |
0.361111 |
26.000000 |
True |
-15.0 |
23.0 |
32.472 |
0.0 |
0 |
0.0 |
39 |
1113 |
-0.063792 |
NaN |
| 2026-03-12 09:00:00+08:00 |
157 |
540 |
Ws_W73 |
1.195586 |
30.000000 |
540.0 |
539.750000 |
541.37 |
541.500000 |
3900.0 |
4053.000000 |
82 |
-0.039991 |
-0.103086 |
-0.107407 |
0.335714 |
0.373171 |
30.600000 |
True |
-15.0 |
7.8 |
36.982 |
0.0 |
0 |
0.0 |
64 |
12 |
-0.065392 |
NaN |
| 2026-03-12 11:20:00+08:00 |
157 |
680 |
Ws_W73 |
1.195586 |
30.000000 |
680.0 |
679.750000 |
681.17 |
681.500000 |
3890.0 |
4038.181818 |
70 |
-0.103558 |
-0.142031 |
-0.129012 |
0.333506 |
0.423377 |
29.636364 |
True |
-15.0 |
19.8 |
31.570 |
0.0 |
0 |
0.0 |
229 |
324 |
-0.107727 |
NaN |
| 2026-03-12 12:35:00+08:00 |
157 |
755 |
Ws_W73 |
1.195586 |
30.000000 |
755.0 |
754.833333 |
756.20 |
756.416667 |
3930.0 |
4072.125000 |
72 |
-0.130462 |
-0.135494 |
-0.129012 |
0.341429 |
0.394792 |
28.425000 |
True |
-10.0 |
13.0 |
32.472 |
0.0 |
0 |
0.0 |
35 |
1482 |
-0.092946 |
NaN |