| 2026-03-13 08:00:01+08:00 |
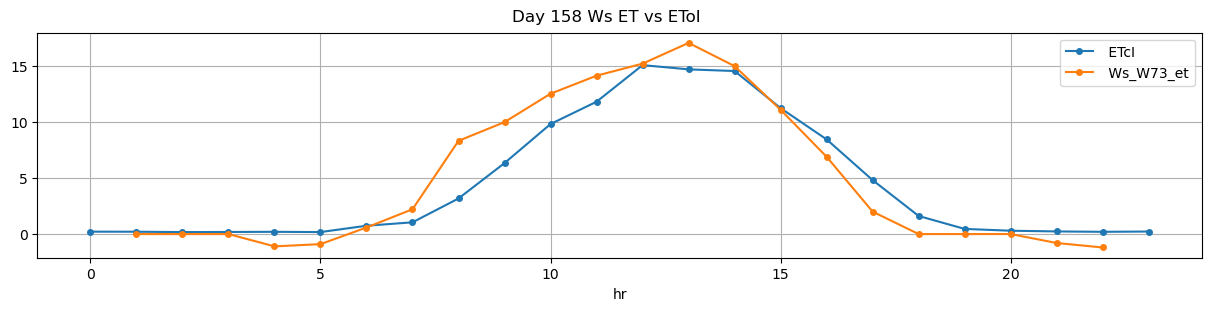
158 |
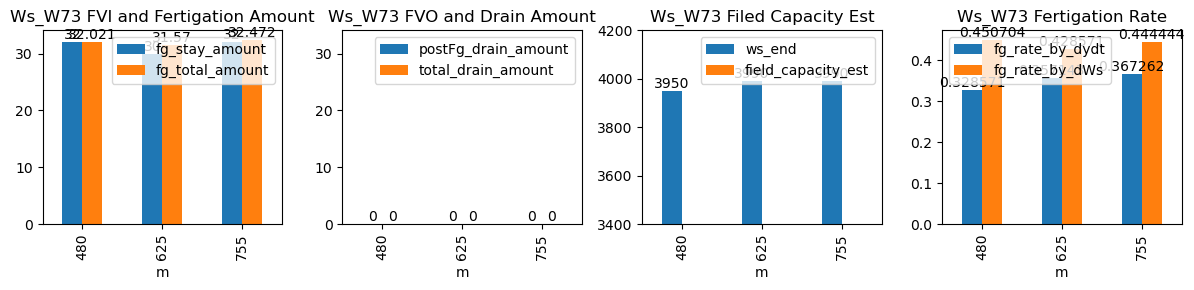
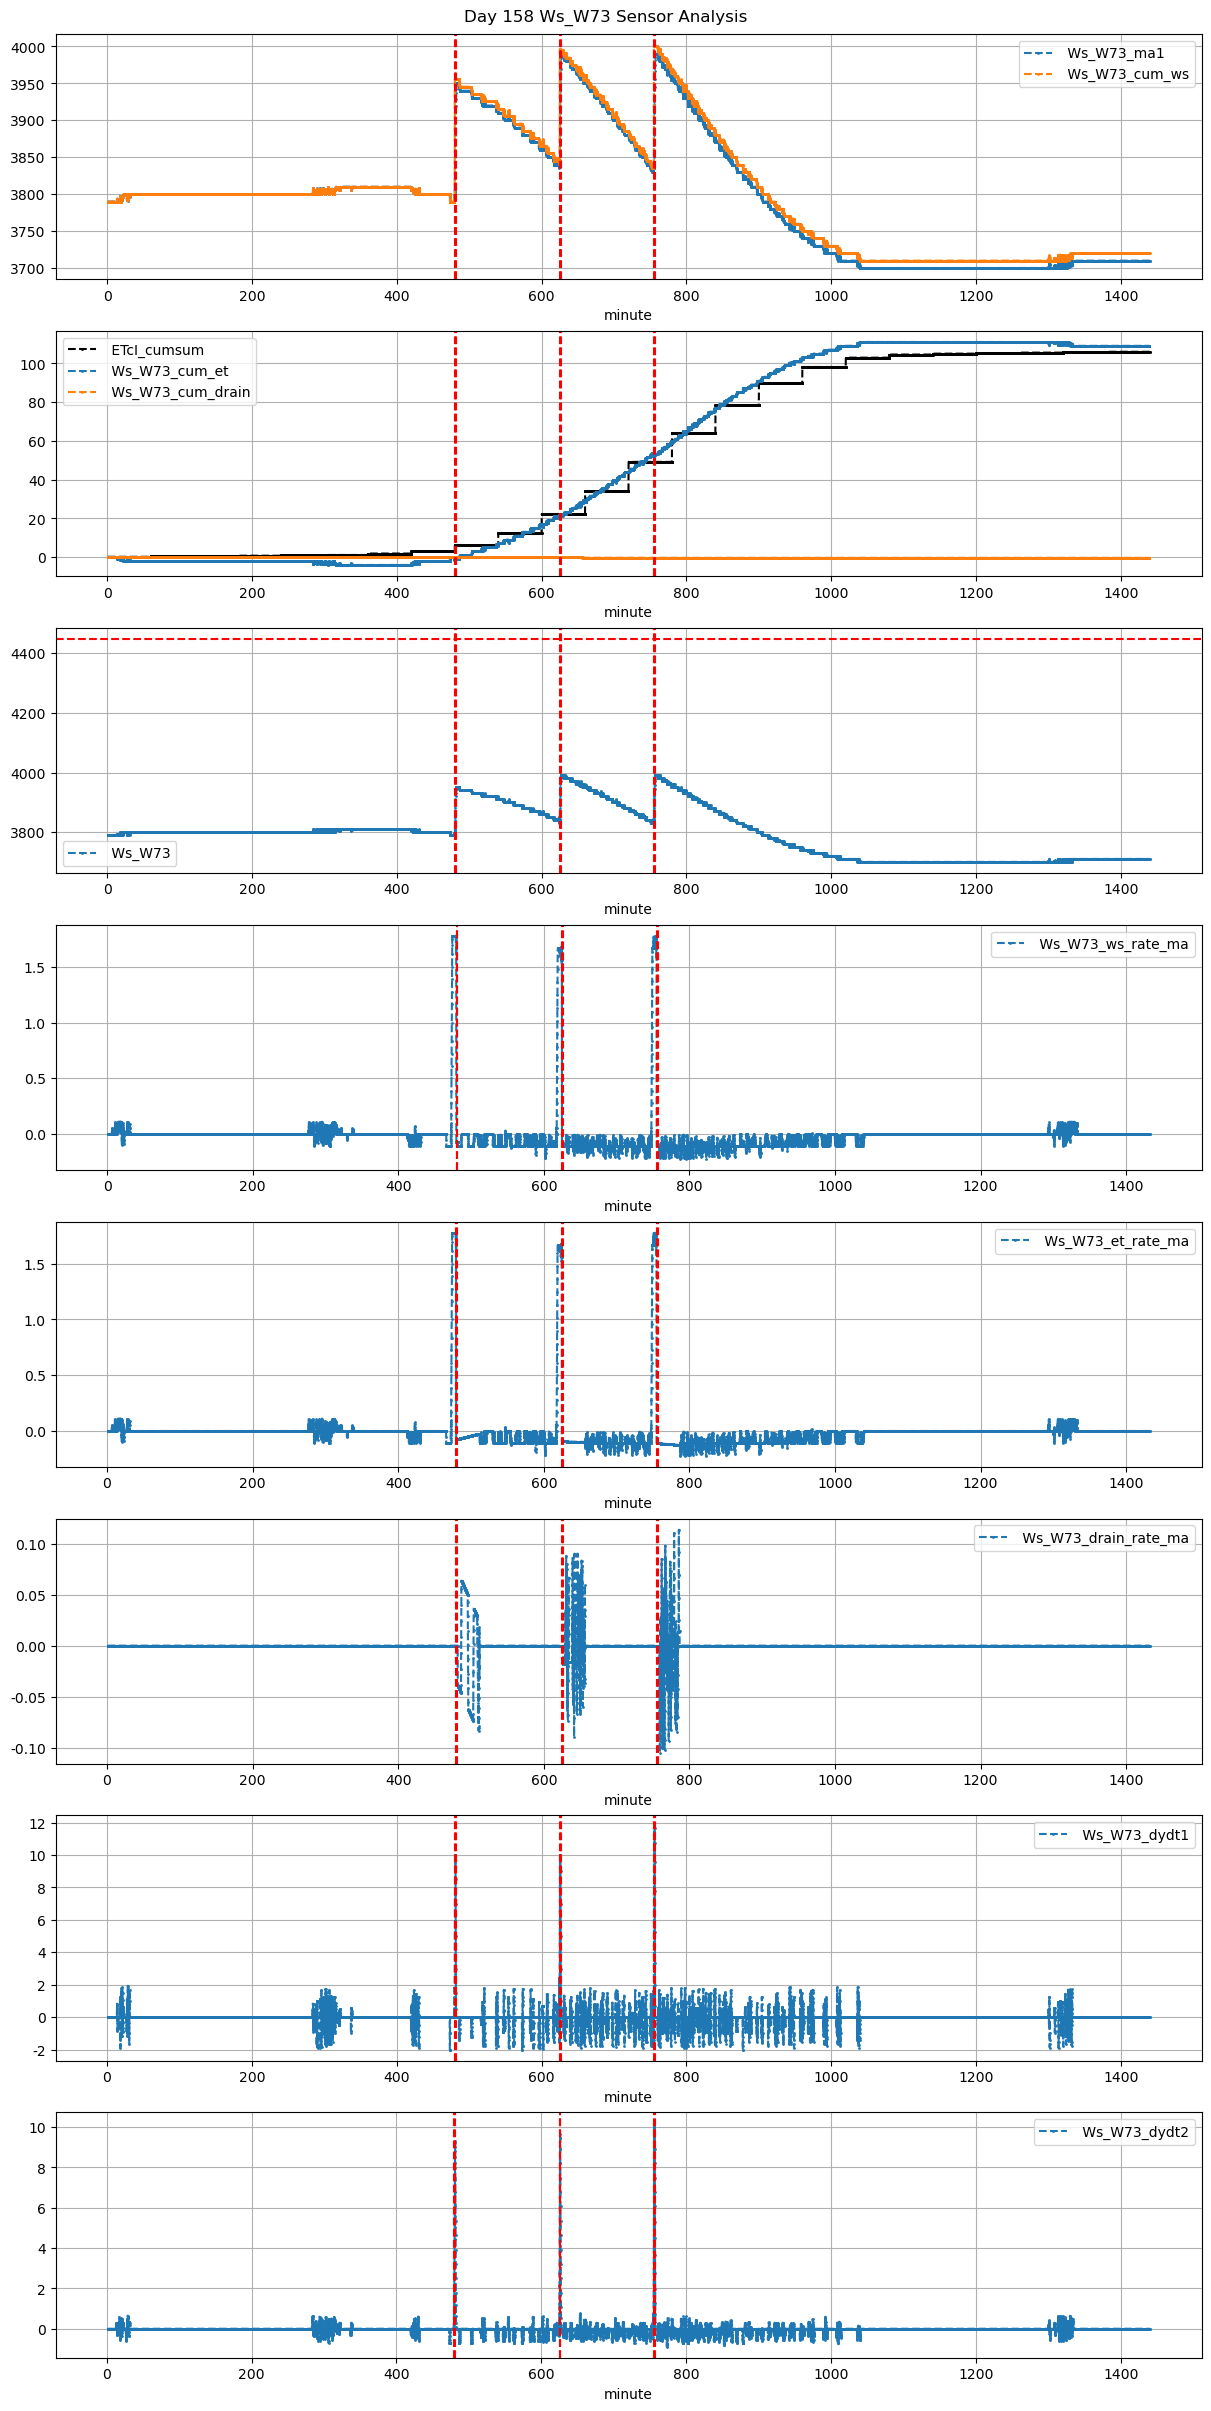
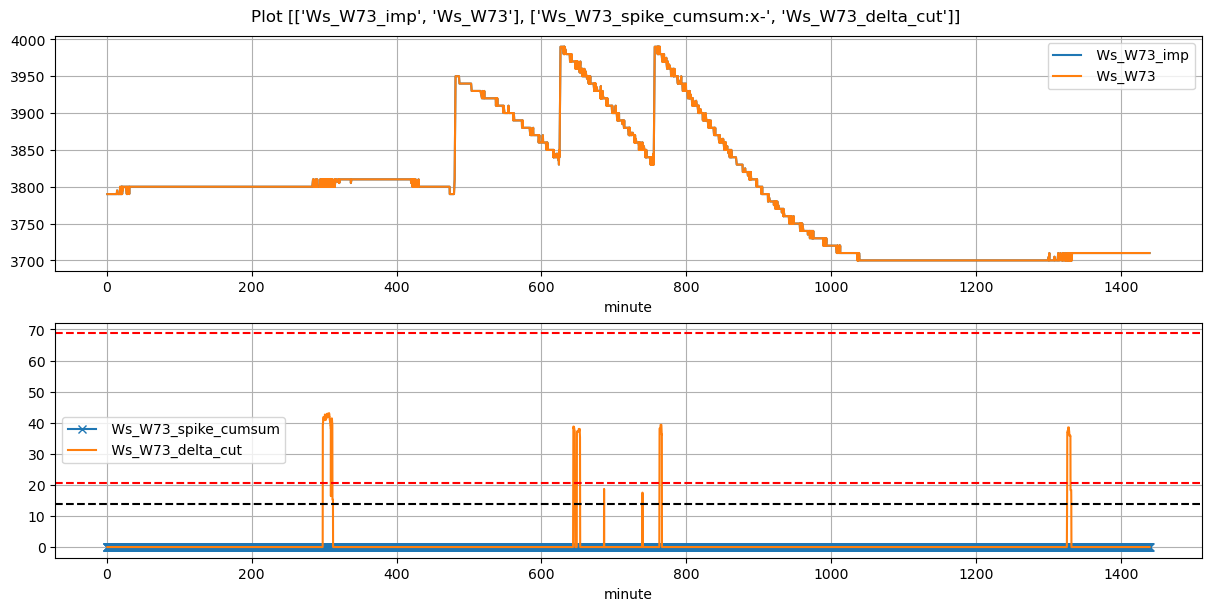
480 |
Ws_W73 |
0.683651 |
30 |
480.02 |
479.583333 |
481.20 |
481.666667 |
3790.0 |
3950.0 |
71 |
-0.092441 |
-0.072222 |
-0.023333 |
0.328571 |
0.450704 |
32.0 |
True |
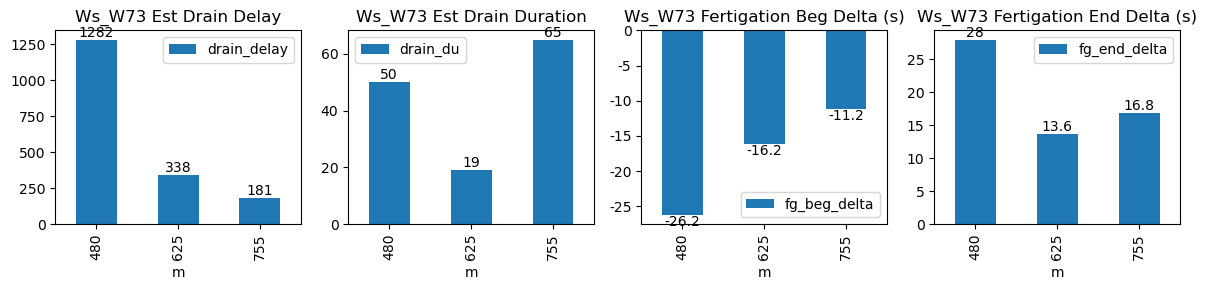
-26.2 |
28.0 |
32.021 |
0.0 |
0 |
0.0 |
50 |
1282 |
-0.072968 |
NaN |
| 2026-03-13 10:25:01+08:00 |
158 |
625 |
Ws_W73 |
0.683651 |
30 |
625.02 |
624.750000 |
626.19 |
626.416667 |
3840.0 |
3990.0 |
70 |
-0.095194 |
-0.093347 |
-0.098080 |
0.357143 |
0.428571 |
30.0 |
True |
-16.2 |
13.6 |
31.570 |
0.0 |
0 |
0.0 |
19 |
338 |
-0.057227 |
NaN |
| 2026-03-13 12:35:01+08:00 |
158 |
755 |
Ws_W73 |
0.683651 |
30 |
755.02 |
754.833333 |
756.22 |
756.500000 |
3830.0 |
3990.0 |
72 |
-0.110175 |
-0.134465 |
-0.125329 |
0.367262 |
0.444444 |
32.0 |
True |
-11.2 |
16.8 |
32.472 |
0.0 |
0 |
0.0 |
65 |
181 |
-0.084160 |
NaN |