| 2026-03-15 08:20:00+08:00 |
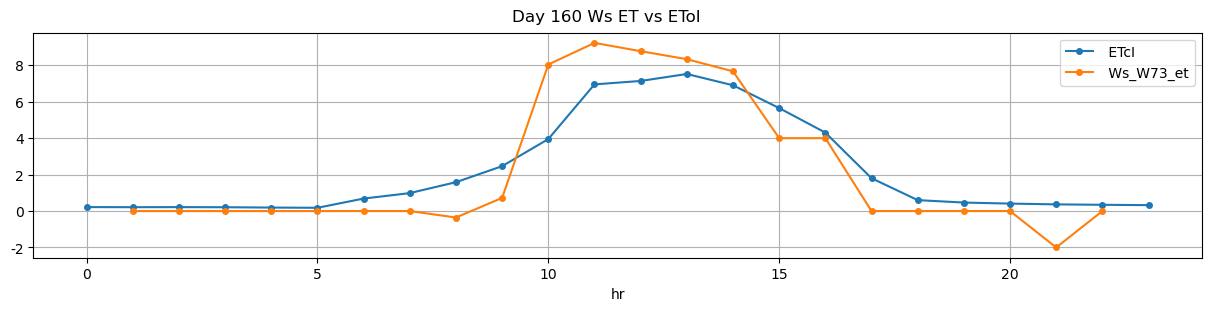
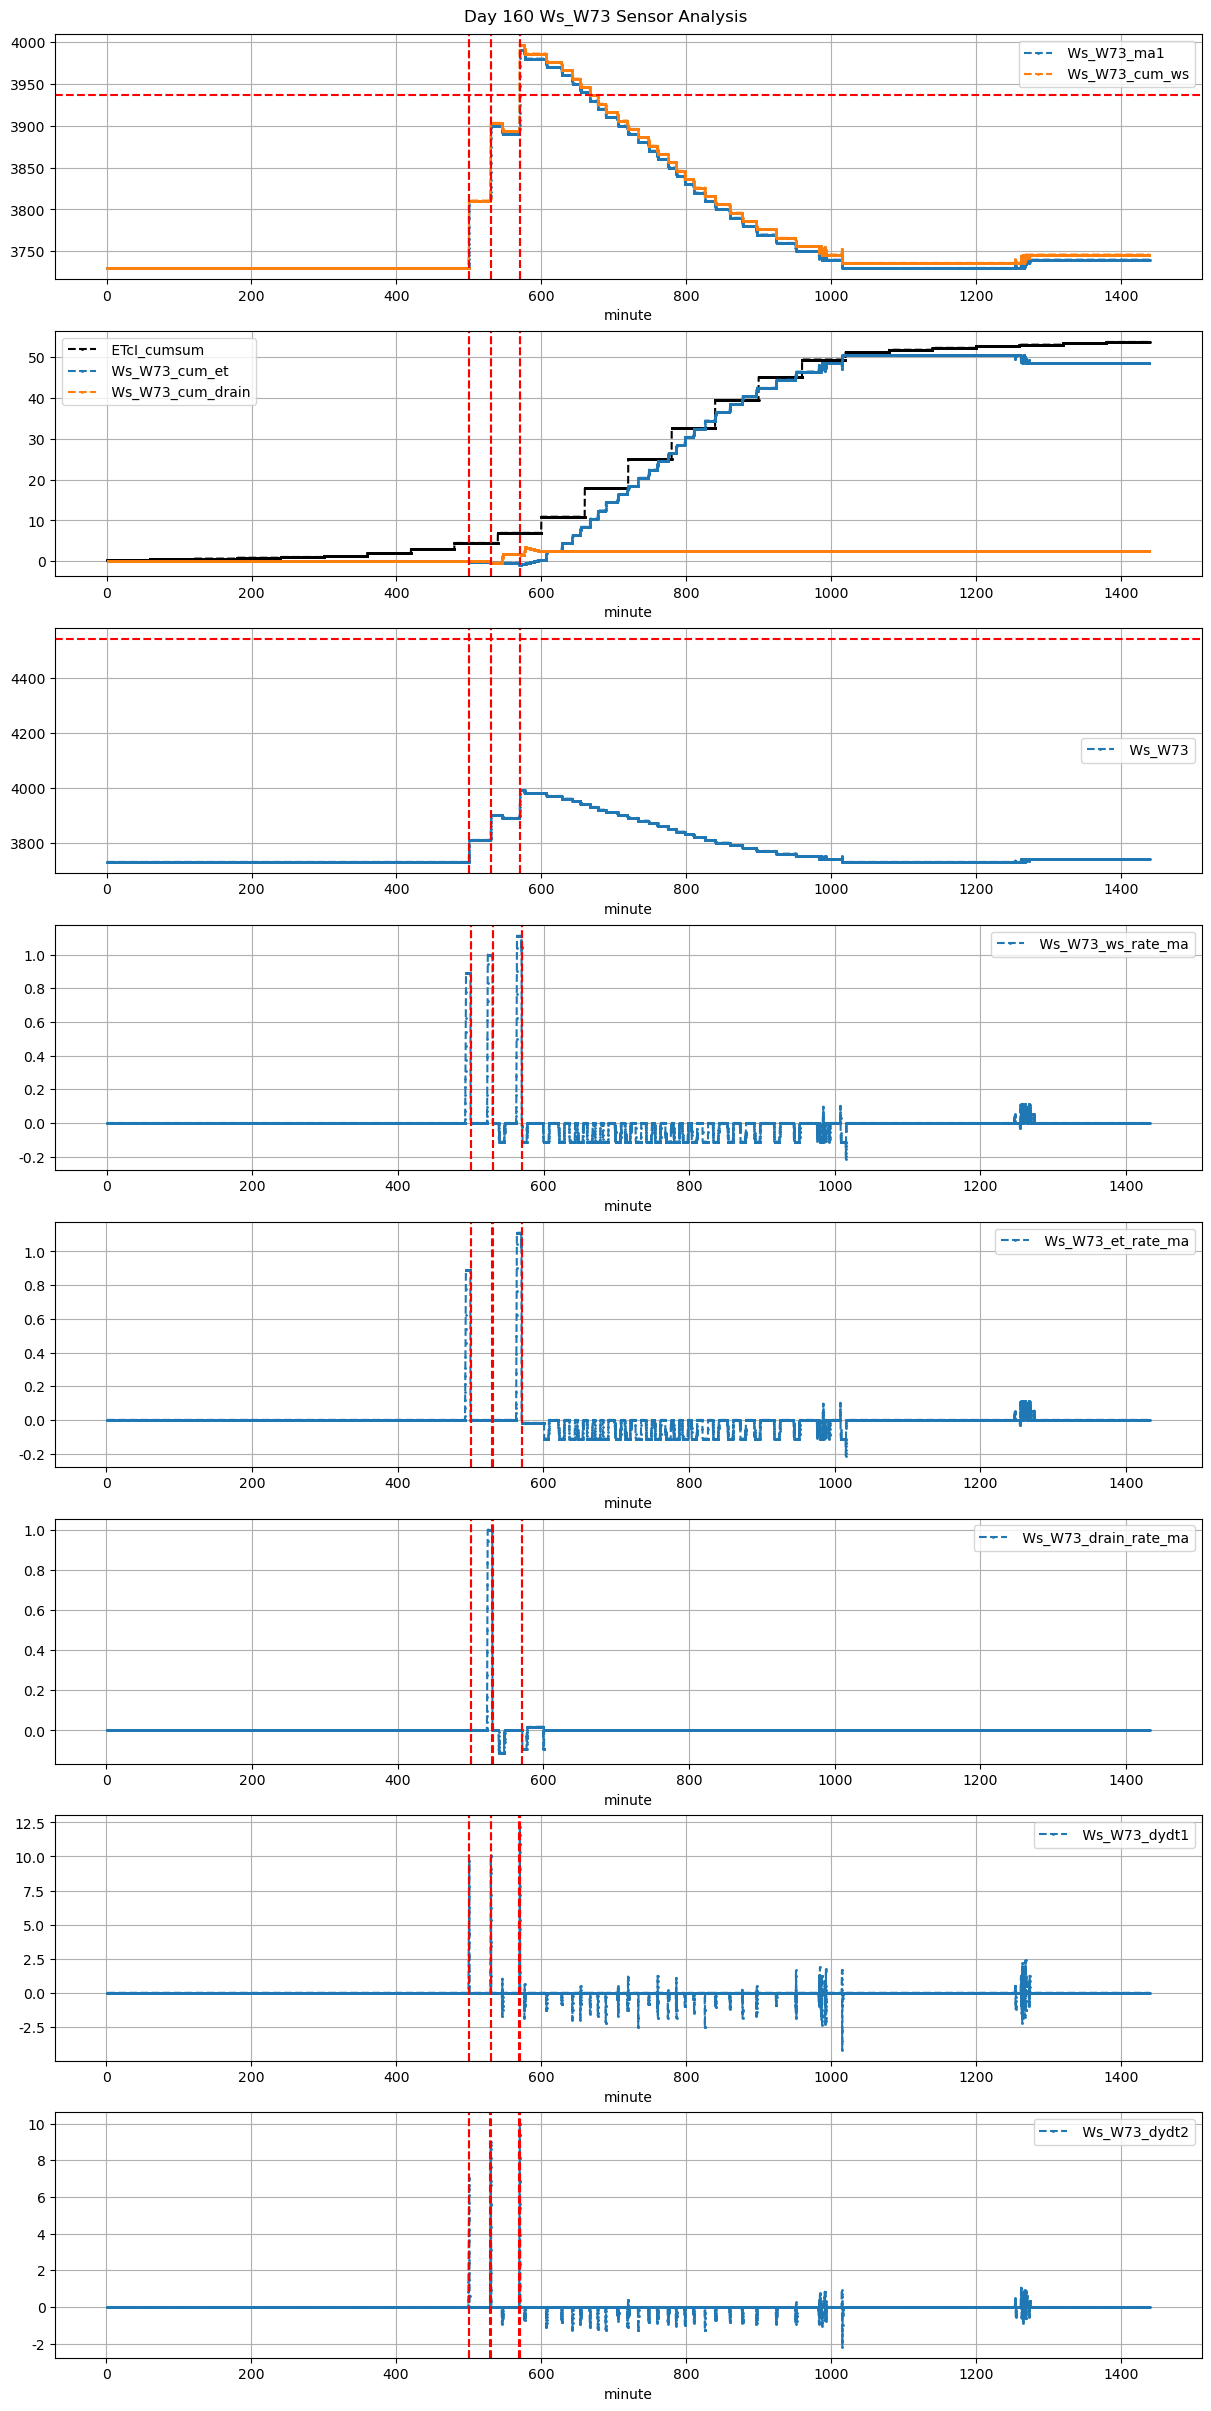
160 |
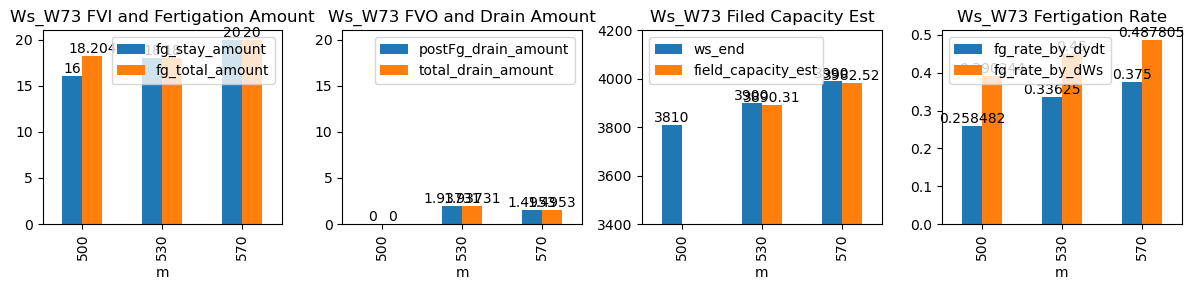
500 |
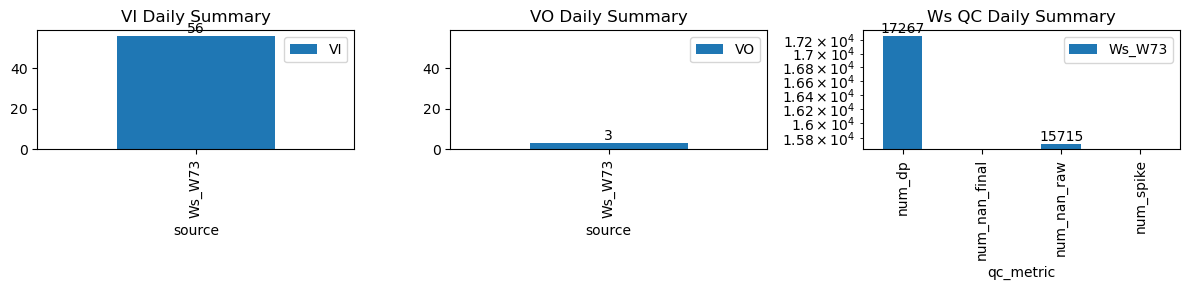
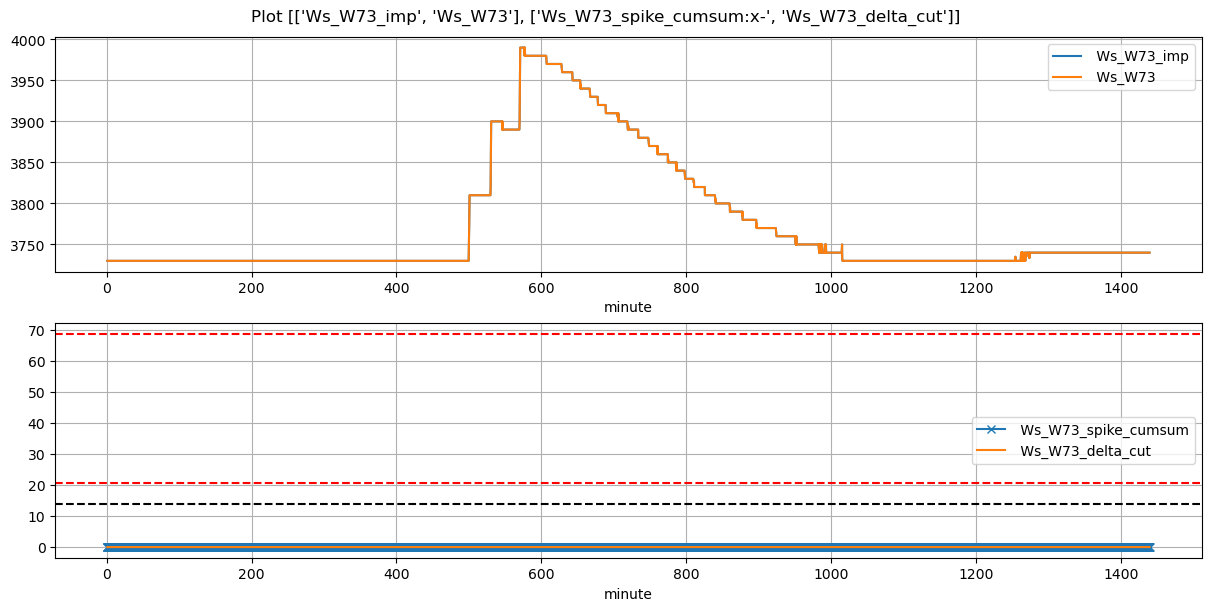
Ws_W73 |
1.734272 |
29.083333 |
500.0 |
499.750000 |
500.68 |
500.916667 |
3730.0 |
3810.0 |
41 |
0.000000 |
0.000000 |
0.000000 |
0.258482 |
0.390244 |
16.0 |
True |
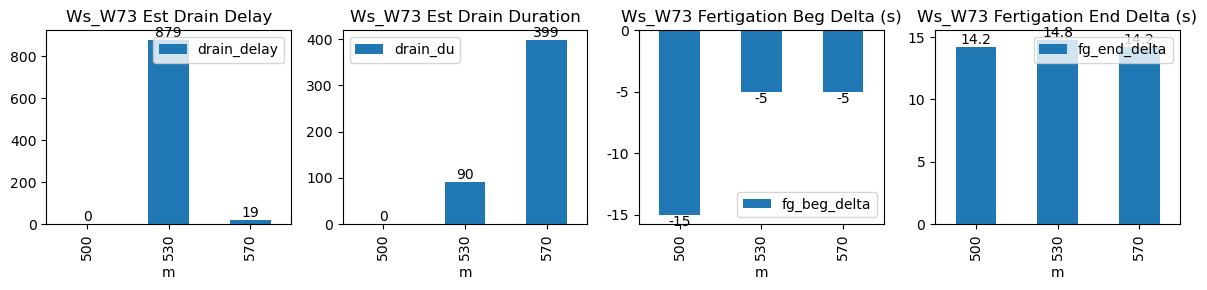
-15.0 |
14.2 |
18.204 |
0.0 |
0.000000 |
0.000000 |
NaN |
NaN |
NaN |
NaN |
| 2026-03-15 08:50:00+08:00 |
160 |
530 |
Ws_W73 |
1.734272 |
30.000000 |
530.0 |
529.916667 |
530.67 |
530.916667 |
3810.0 |
3900.0 |
40 |
-0.017104 |
-0.000103 |
0.000000 |
0.336250 |
0.450000 |
18.0 |
True |
-5.0 |
14.8 |
18.000 |
0.0 |
1.937307 |
1.937307 |
90.0 |
879.0 |
-0.111058 |
3890.313464 |
| 2026-03-15 09:30:00+08:00 |
160 |
570 |
Ws_W73 |
1.734272 |
30.000000 |
570.0 |
569.916667 |
570.68 |
570.916667 |
3890.0 |
3990.0 |
41 |
-0.017104 |
-0.093621 |
-0.018519 |
0.375000 |
0.487805 |
20.0 |
True |
-5.0 |
14.2 |
20.000 |
0.0 |
1.495297 |
1.495297 |
399.0 |
19.0 |
-0.093984 |
3982.523517 |