| 2026-03-20 08:25:01+08:00 |
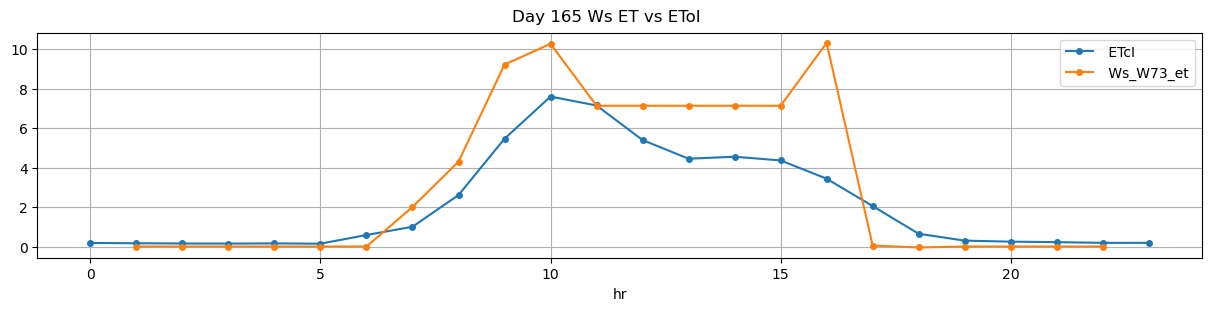
165 |
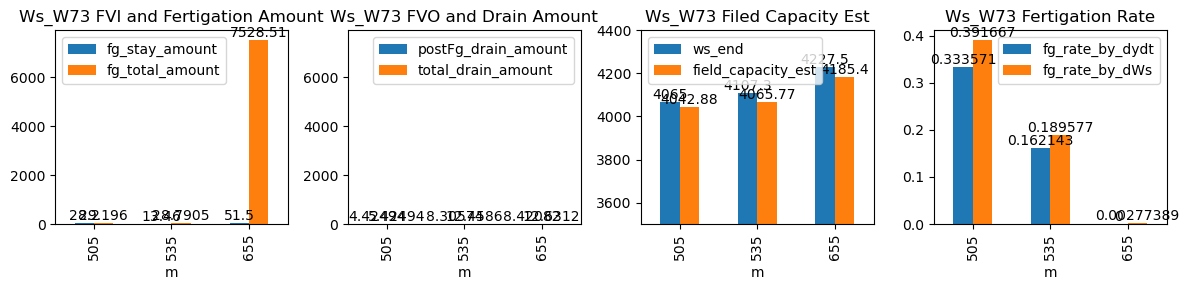
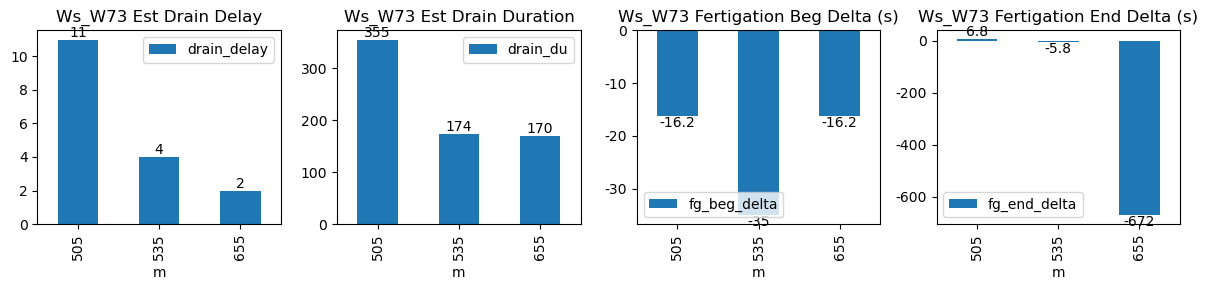
505 |
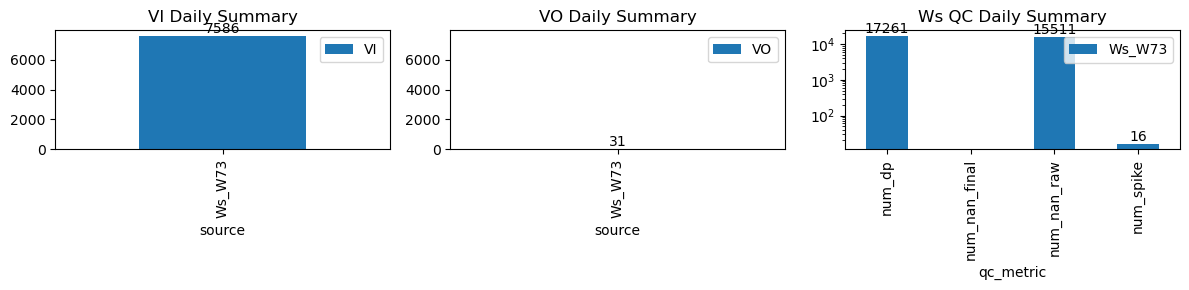
Ws_W73 |
2.474051 |
28.666667 |
505.02 |
504.750000 |
506.22 |
506.333333 |
3924.0 |
4065.0 |
72 |
-0.024605 |
-0.096914 |
0.000000 |
0.333571 |
0.391667 |
28.20 |
True |
-16.2 |
6.8 |
29.1960 |
1.000000 |
4.424939 |
5.424939 |
355 |
11 |
-0.190495 |
4042.875305 |
| 2026-03-20 08:55:00+08:00 |
165 |
535 |
Ws_W73 |
2.474051 |
30.000000 |
535.00 |
534.416667 |
536.18 |
536.083333 |
4040.0 |
4107.3 |
71 |
-0.037911 |
-0.081636 |
-0.107476 |
0.162143 |
0.189577 |
13.46 |
True |
-35.0 |
-5.8 |
28.7905 |
4.152871 |
8.305743 |
12.458614 |
174 |
4 |
-0.110939 |
4065.771285 |
| 2026-03-20 10:55:01+08:00 |
165 |
655 |
Ws_W73 |
2.474051 |
30.000000 |
655.02 |
654.750000 |
964.45 |
953.250000 |
3970.0 |
4227.5 |
18566 |
-0.049501 |
-0.069259 |
0.000000 |
0.000000 |
0.002774 |
51.50 |
True |
-16.2 |
-672.0 |
7528.5130 |
4.210410 |
8.420821 |
12.631231 |
170 |
2 |
-0.384218 |
4185.395896 |