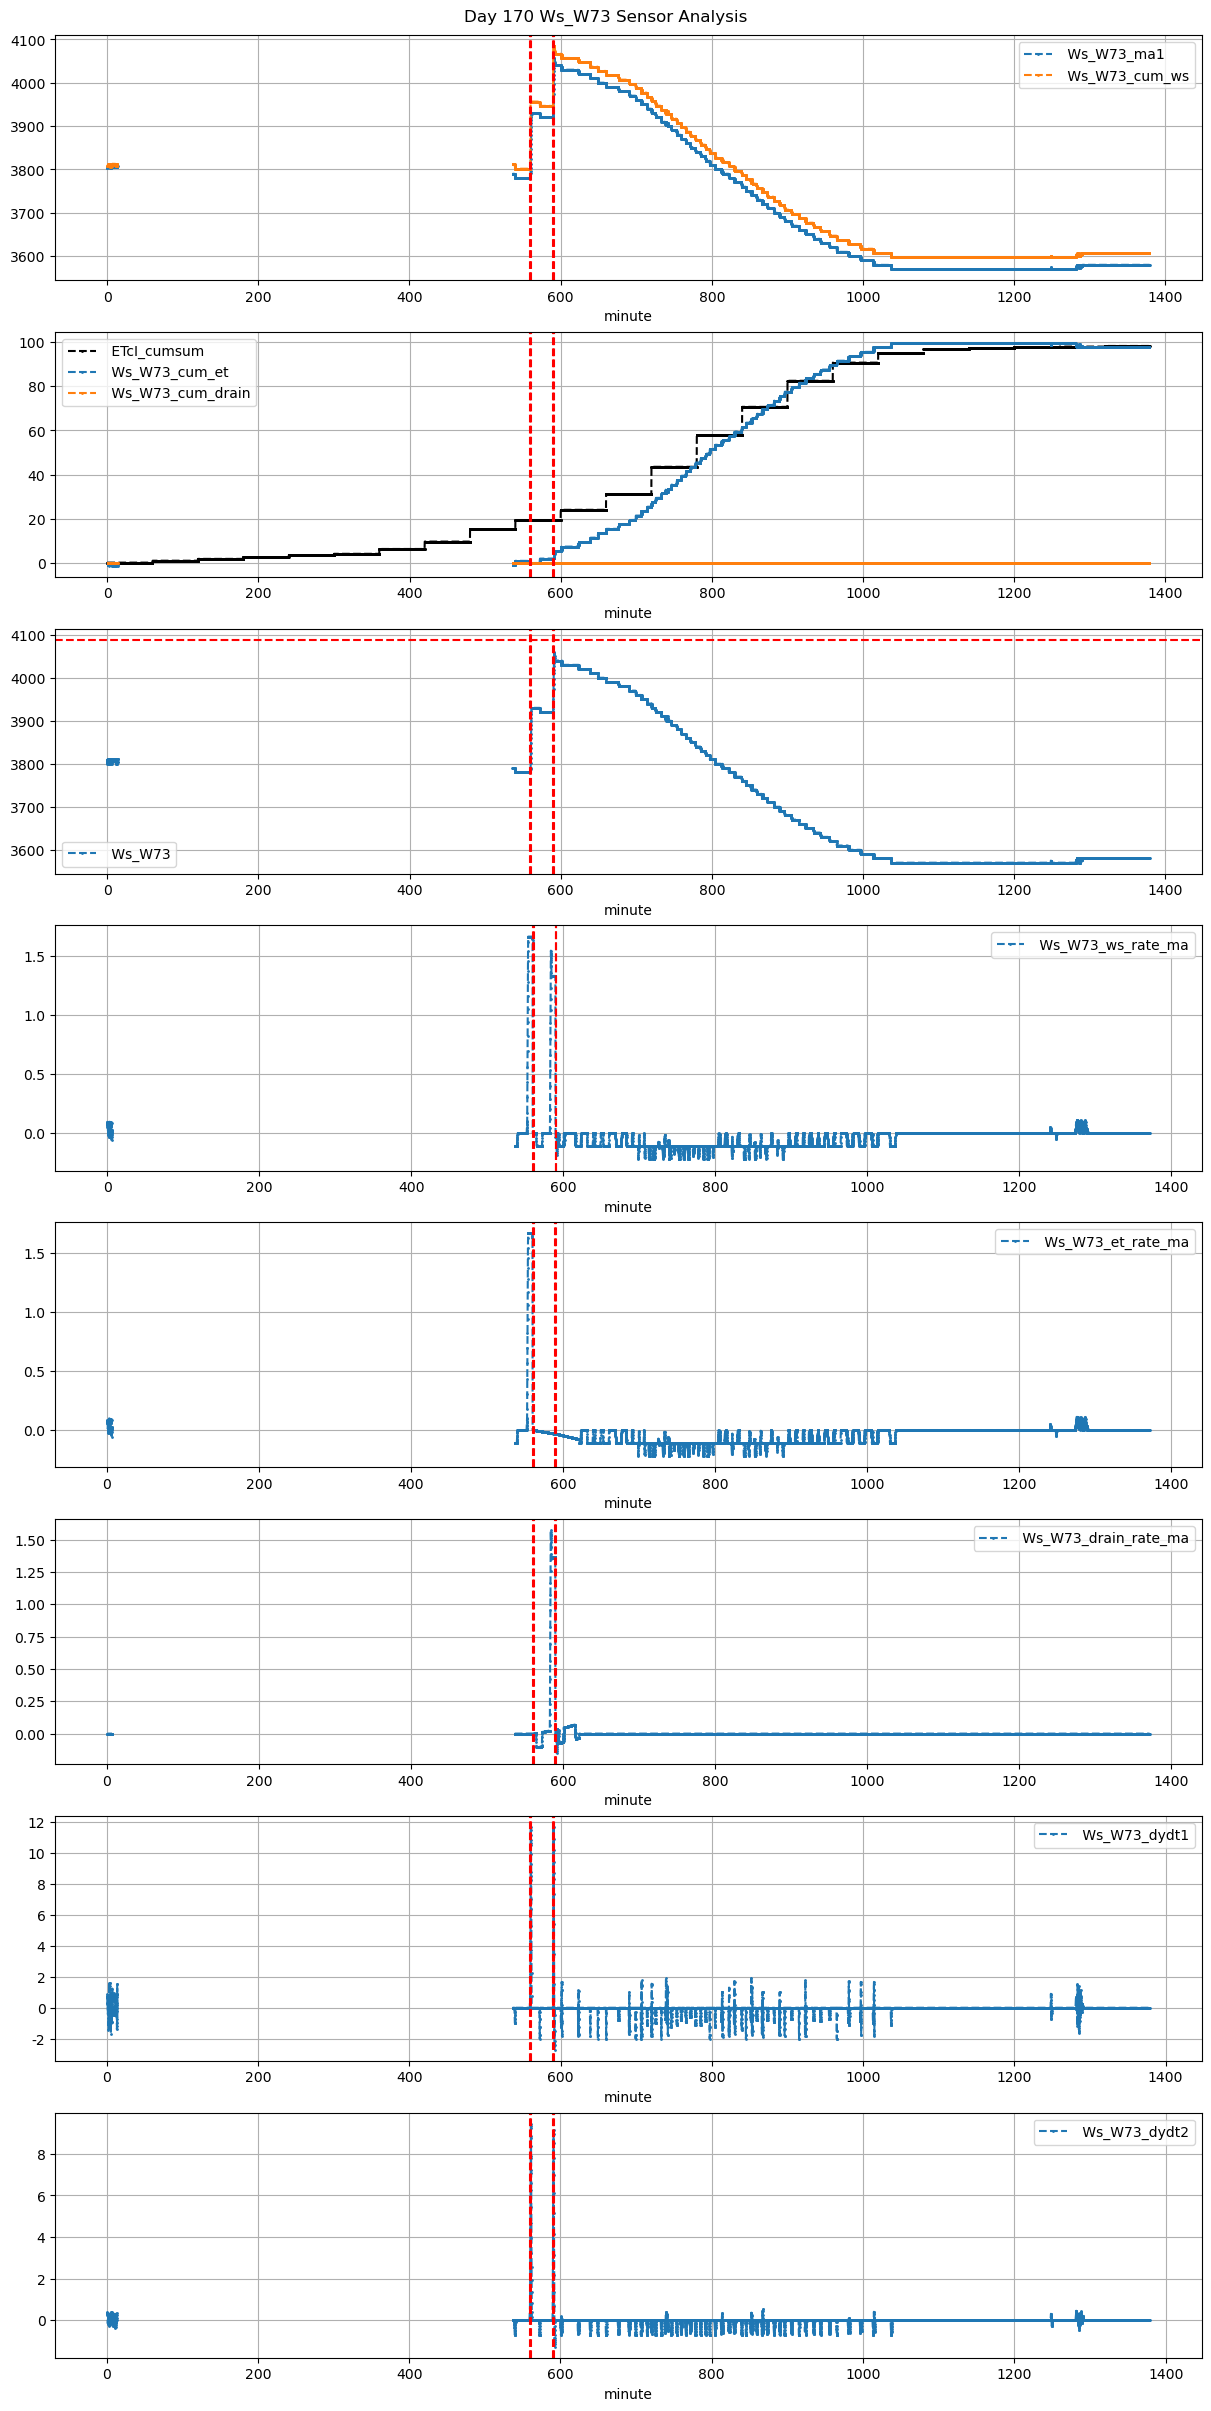
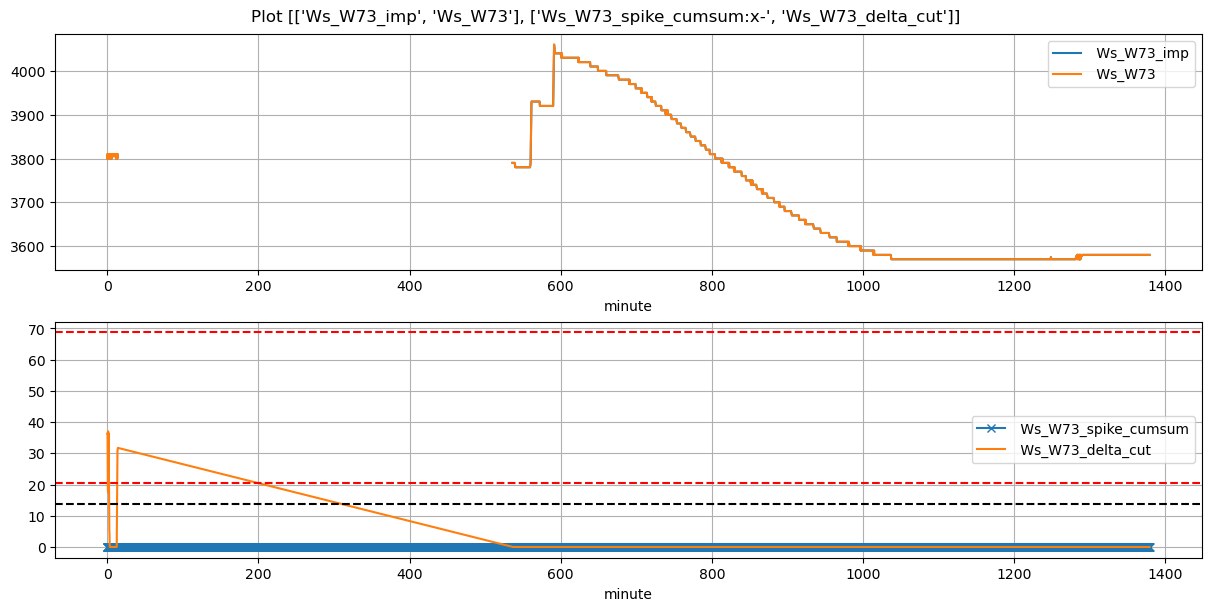
VI and VO Daily Summary
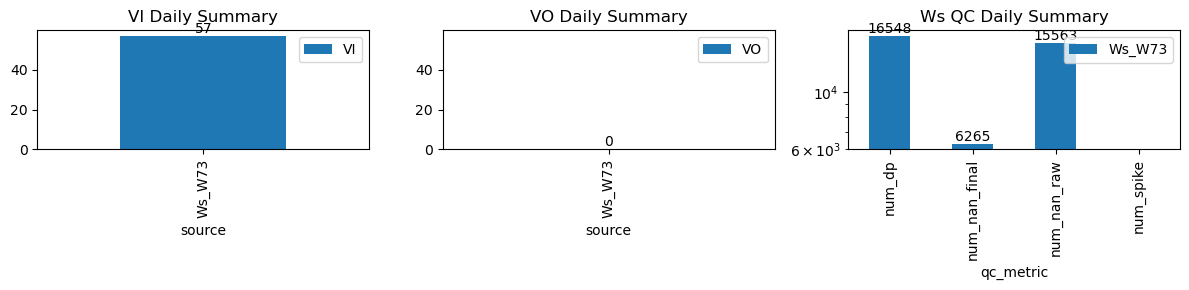
| ws_name | num_dp | num_nan_raw | num_nan_final | num_spike | cum_step_adj |
|---|---|---|---|---|---|
| Ws_W73 | 16,548 | 15,563 | 6,265 | 0 | 0.00 |
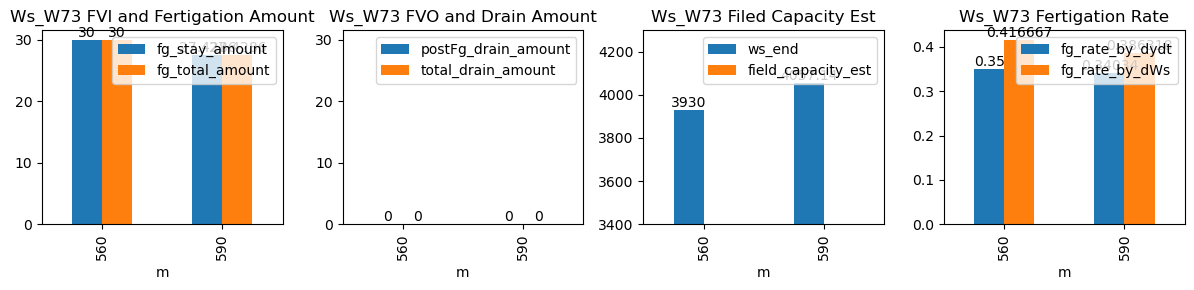
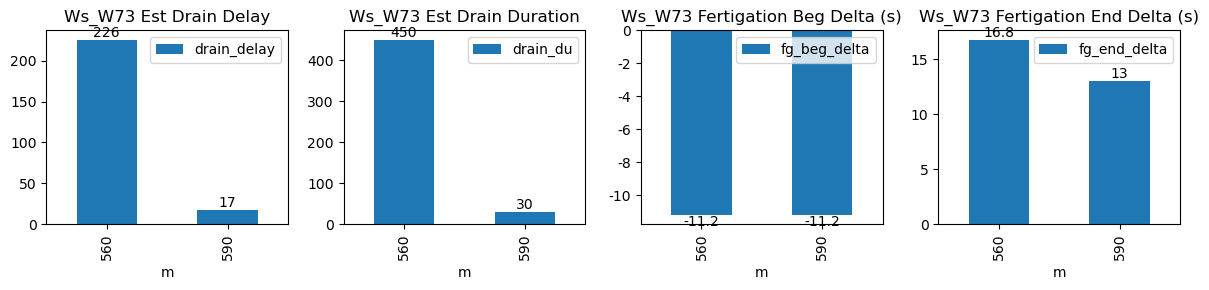
| ds | d | m | ws_name | prominence_cut | max_drain_du | fg_beg | fg_beg_est | fg_end | fg_end_est | ws_beg | ws_end | duc | pre_fg_et | post_fg_ws | post_drn_et | fg_rate_by_dydt | fg_rate_by_dWs | fg_stay_amount | enough_data | fg_beg_delta | fg_end_delta | fg_total_amount | fg_drain_amount | postFg_drain_amount | total_drain_amount | drain_du | drain_delay | drain_rate | field_capacity_est |
|---|---|---|---|---|---|---|---|---|---|---|---|---|---|---|---|---|---|---|---|---|---|---|---|---|---|---|---|---|---|
| 2026-03-25 09:20:01+08:00 | 170 | 560 | Ws_W73 | 1.26312 | 28.5 | 560.02 | 559.833333 | 561.22 | 561.500000 | 3780.0 | 3930.000000 | 72 | 0.000000 | -0.061728 | 0.000000 | 0.35000 | 0.416667 | 30.000000 | True | -11.2 | 16.8 | 30.000000 | 0.0 | 0 | 0.0 | 450 | 226 | -0.106686 | NaN |
| 2026-03-25 09:50:01+08:00 | 170 | 590 | Ws_W73 | 1.26312 | 30.0 | 590.02 | 589.833333 | 591.20 | 591.416667 | 3920.0 | 4057.142857 | 71 | -0.032251 | -0.093915 | -0.079012 | 0.34034 | 0.386318 | 27.428571 | True | -11.2 | 13.0 | 27.428571 | 0.0 | 0 | 0.0 | 30 | 17 | -0.075474 | NaN |