| 2026-03-28 08:13:36+08:00 |
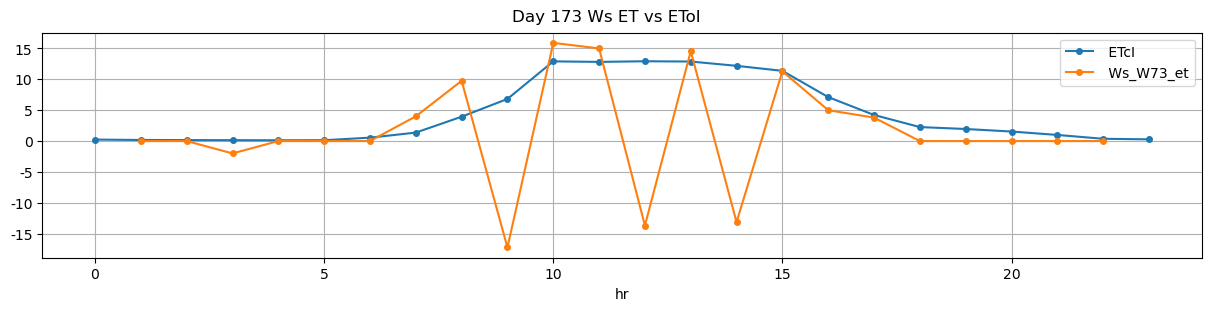
173 |
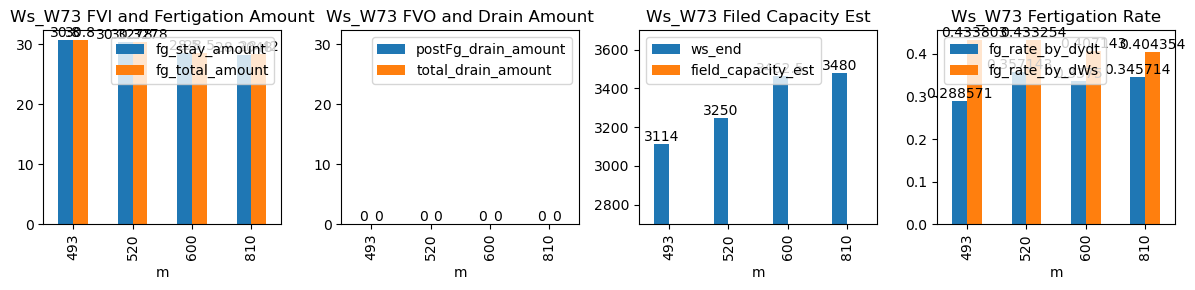
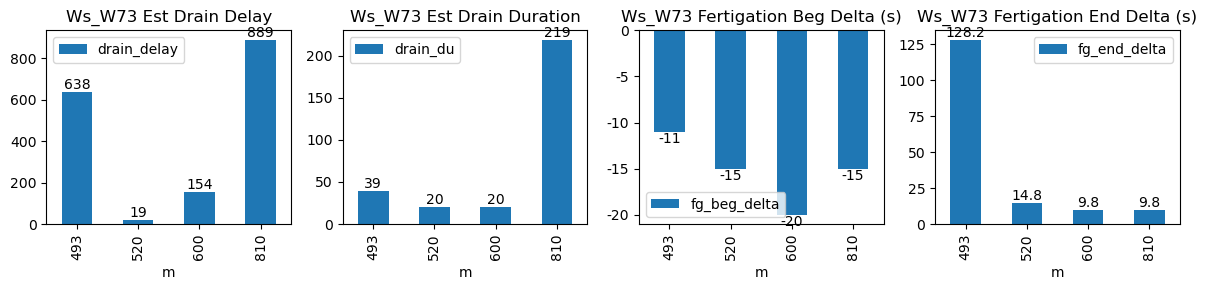
493 |
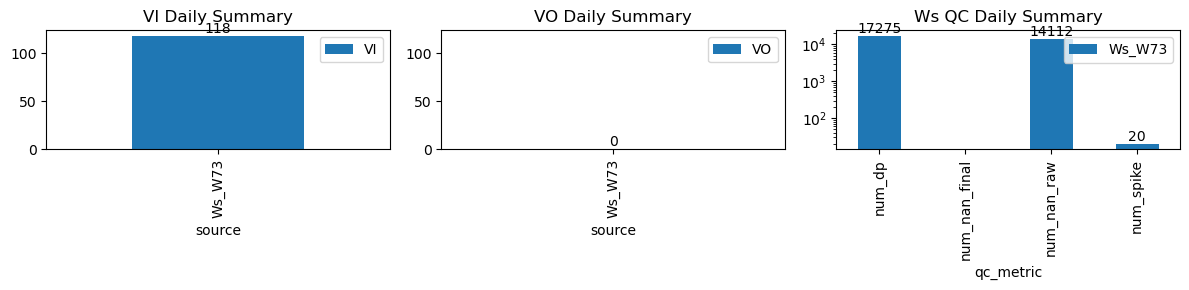
Ws_W73 |
0.901225 |
23.083333 |
493.6 |
493.416667 |
494.78 |
496.916667 |
2960.000000 |
3114.0 |
71 |
-0.078748 |
-0.075340 |
0.000000 |
0.288571 |
0.433803 |
30.800000 |
True |
-11.0 |
128.2 |
30.800000 |
0.0 |
0 |
0.0 |
39 |
638 |
-0.046118 |
NaN |
| 2026-03-28 08:40:00+08:00 |
173 |
520 |
Ws_W73 |
0.901225 |
30.000000 |
520.0 |
519.750000 |
521.17 |
521.416667 |
3098.361111 |
3250.0 |
70 |
-0.047367 |
-0.069136 |
-0.072222 |
0.357143 |
0.433254 |
30.327778 |
True |
-15.0 |
14.8 |
30.327778 |
0.0 |
0 |
0.0 |
20 |
19 |
-0.060016 |
NaN |
| 2026-03-28 10:00:00+08:00 |
173 |
600 |
Ws_W73 |
0.901225 |
30.000000 |
600.0 |
599.666667 |
601.17 |
601.333333 |
3320.000000 |
3462.5 |
70 |
-0.124705 |
-0.099794 |
-0.113814 |
0.337500 |
0.407143 |
28.500000 |
True |
-20.0 |
9.8 |
28.500000 |
0.0 |
0 |
0.0 |
20 |
154 |
-0.080665 |
NaN |
| 2026-03-28 13:30:00+08:00 |
173 |
810 |
Ws_W73 |
0.901225 |
30.000000 |
810.0 |
809.750000 |
811.17 |
811.333333 |
3338.476190 |
3480.0 |
70 |
-0.143380 |
-0.076389 |
0.000000 |
0.345714 |
0.404354 |
28.304762 |
True |
-15.0 |
9.8 |
28.420000 |
0.0 |
0 |
0.0 |
219 |
889 |
-0.196450 |
NaN |