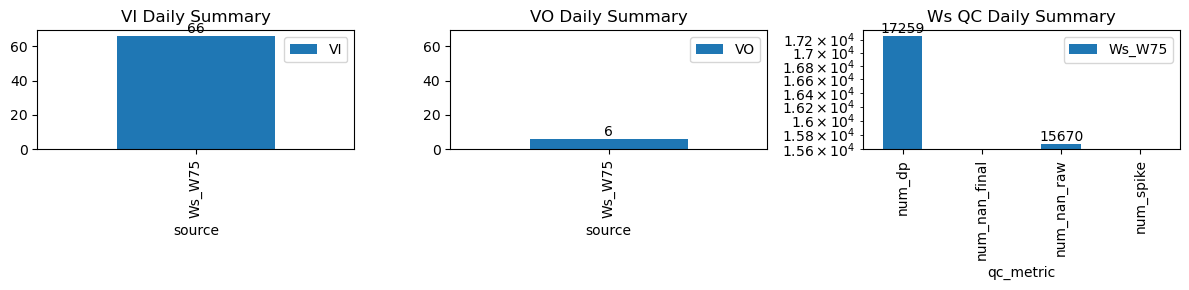
VI and VO Daily Summary
| ws_name | num_dp | num_nan_raw | num_nan_final | num_spike | cum_step_adj |
|---|---|---|---|---|---|
| Ws_W75 | 17,259 | 15,670 | 0 | 0 | 0.00 |
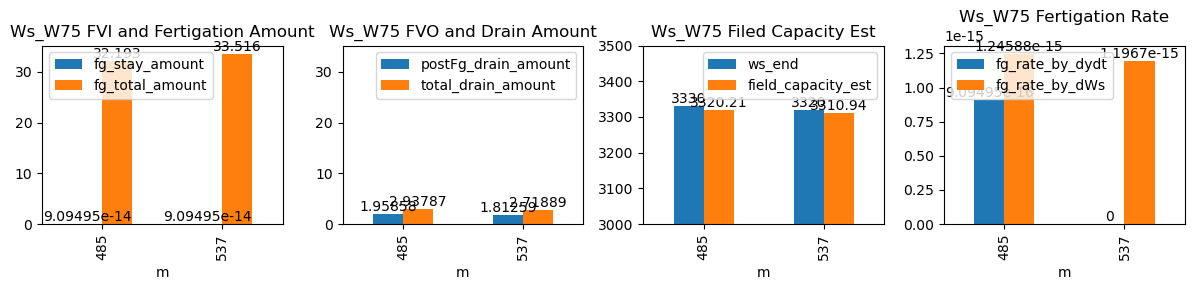
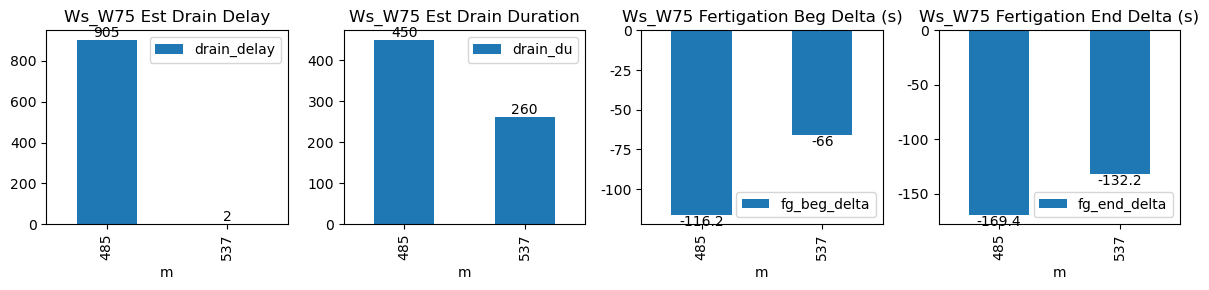
| ds | d | m | ws_name | prominence_cut | max_drain_du | fg_beg | fg_beg_est | fg_end | fg_end_est | ws_beg | ws_end | duc | pre_fg_et | post_fg_ws | post_drn_et | fg_rate_by_dydt | fg_rate_by_dWs | fg_stay_amount | enough_data | fg_beg_delta | fg_end_delta | fg_total_amount | fg_drain_amount | postFg_drain_amount | total_drain_amount | drain_du | drain_delay | drain_rate | field_capacity_est |
|---|---|---|---|---|---|---|---|---|---|---|---|---|---|---|---|---|---|---|---|---|---|---|---|---|---|---|---|---|---|
| 2026-02-11 08:05:01+08:00 | 128 | 485 | Ws_W75 | 1.253943 | 30 | 485.02 | 483.083333 | 486.24 | 483.166667 | 3330.0 | 3330.0 | 73 | 0.0 | 0.0000 | 0.000000 | NaN | 0.0 | 0.0 | True | -116.2 | -184.4 | 32.193 | 0.0 | 0 | 0.0 | 40 | 1325 | -0.983333 | NaN |
| 2026-02-11 08:57:21+08:00 | 128 | 537 | Ws_W75 | 1.253943 | 30 | 537.35 | 536.250000 | 538.62 | 536.333333 | 3320.0 | 3320.0 | 76 | 0.0 | -0.1375 | -0.123611 | NaN | 0.0 | 0.0 | True | -66.0 | -137.2 | 33.516 | 0.0 | 0 | 0.0 | 35 | 242 | -1.411558 | NaN |