| 2026-02-25 11:38:30+08:00 |
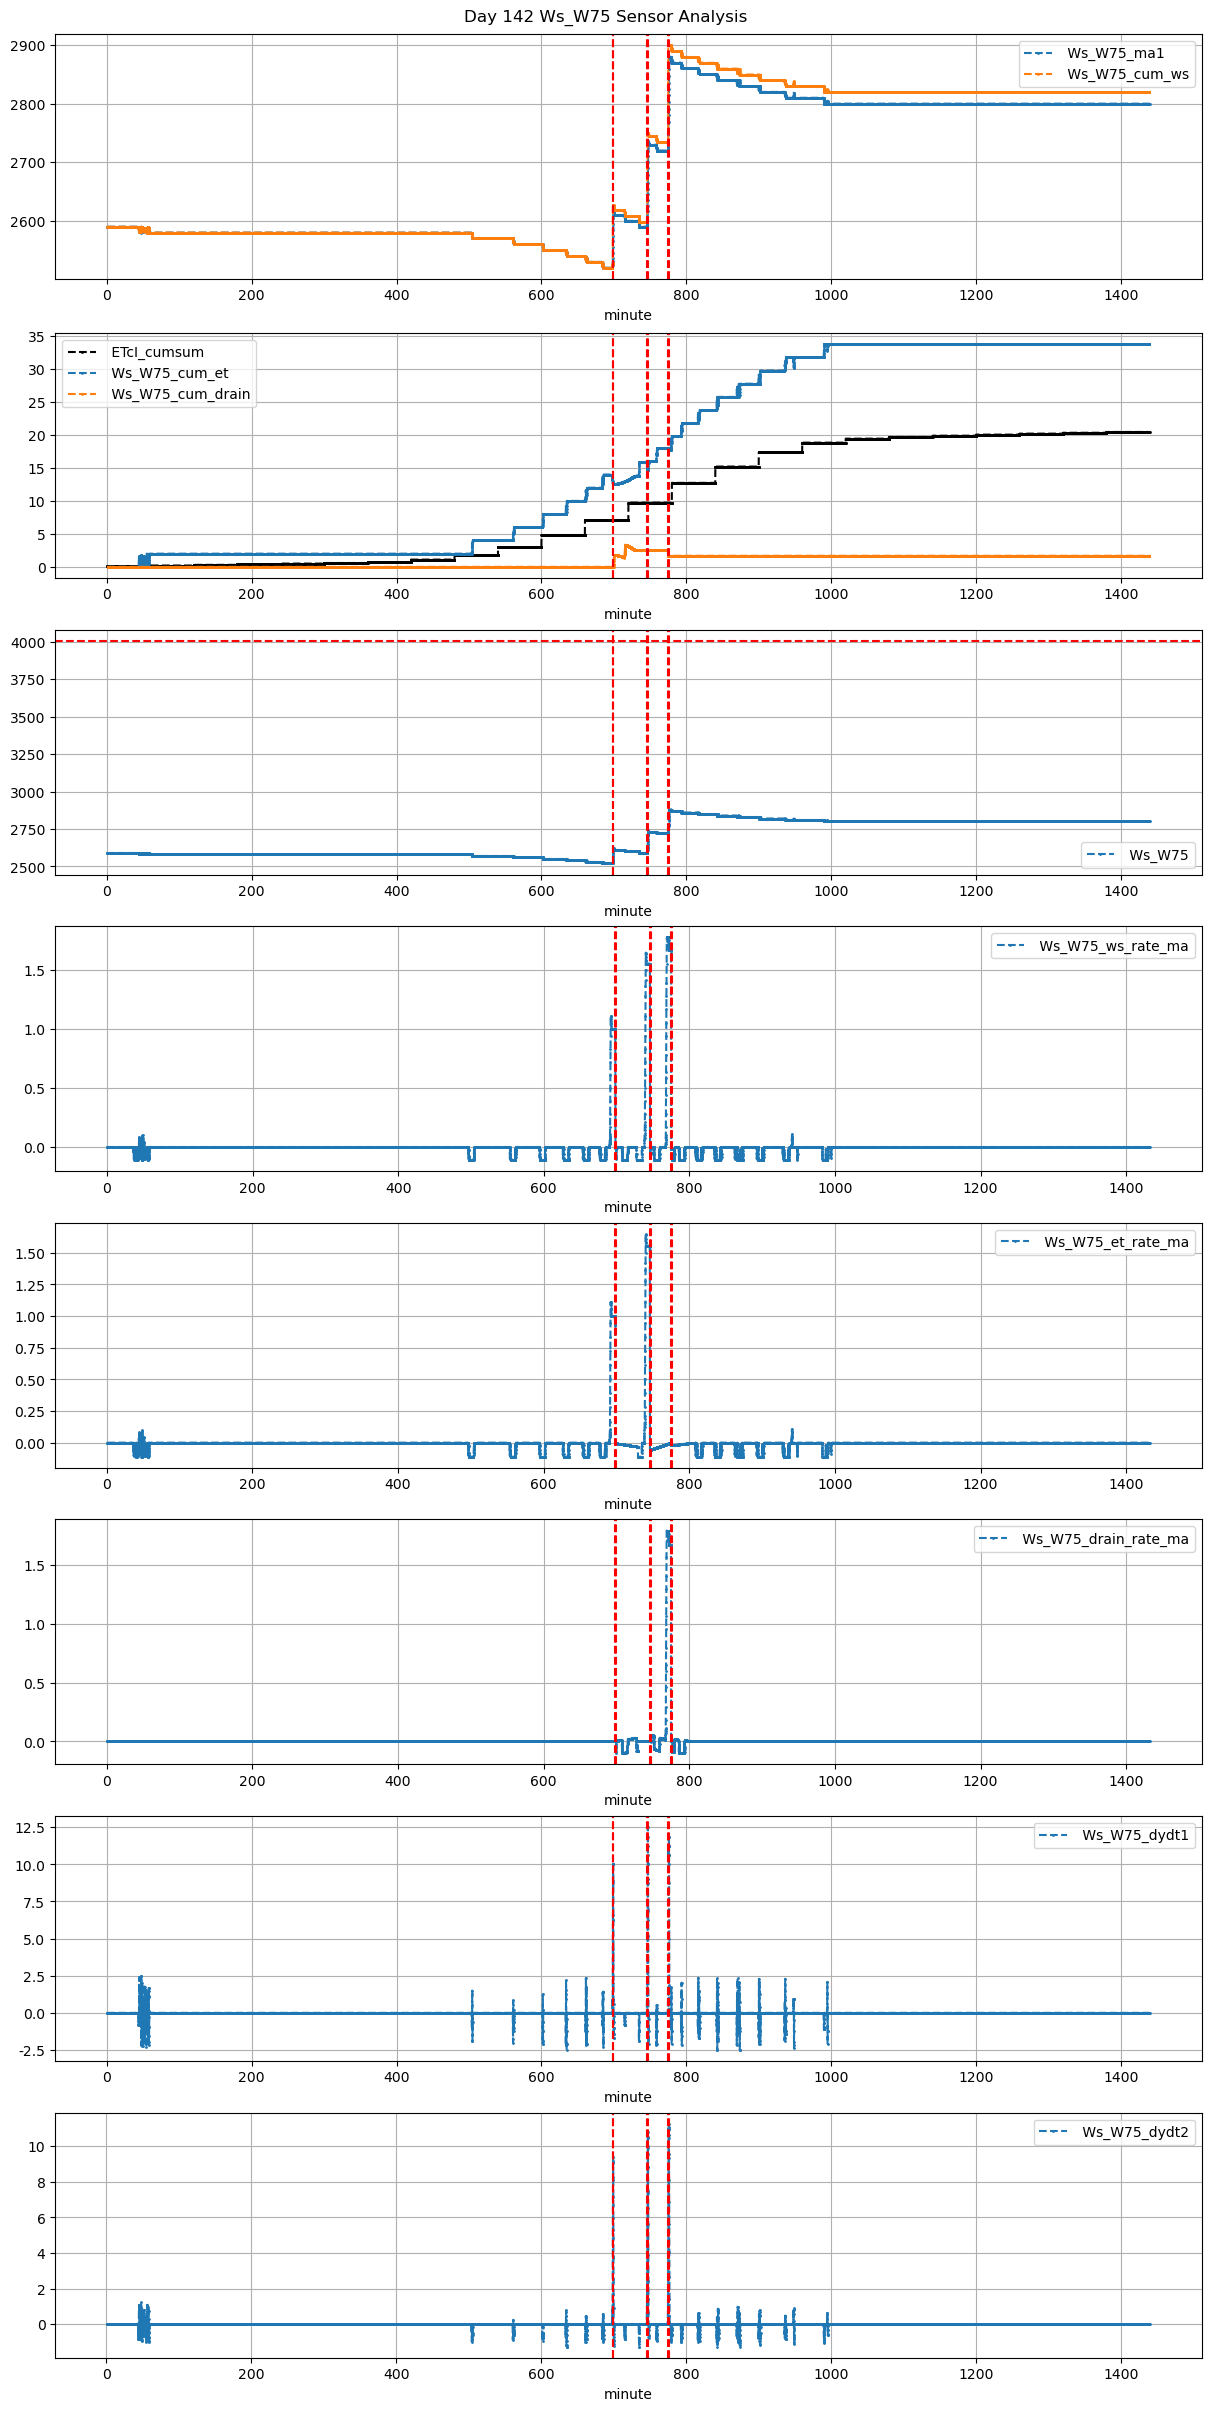
142 |
698 |
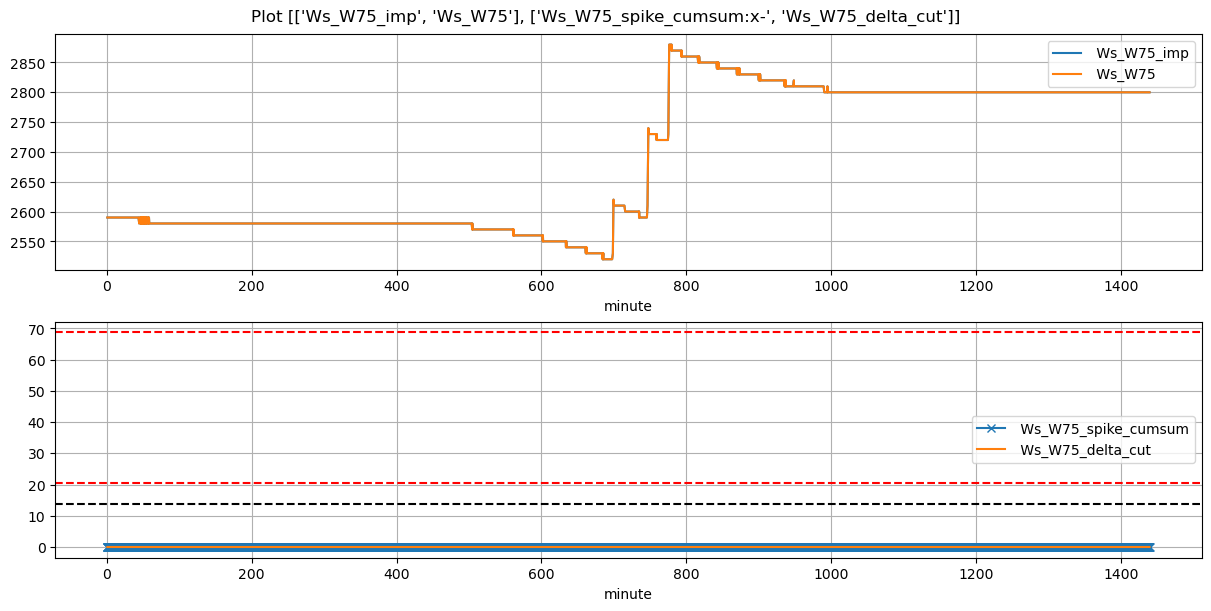
Ws_W75 |
1.510016 |
30.000000 |
698.50 |
698.416667 |
699.23 |
699.333333 |
2520.0 |
2620.0 |
44 |
0.0 |
-0.015278 |
0.0 |
0.35625 |
0.454545 |
20.0 |
True |
-5.0 |
6.2 |
20.000 |
0.0 |
0 |
0.0 |
30 |
31 |
-1.635417 |
NaN |
| 2026-02-25 12:26:14+08:00 |
142 |
746 |
Ws_W75 |
1.510016 |
27.416667 |
746.23 |
745.916667 |
747.36 |
747.583333 |
2590.0 |
2740.0 |
68 |
0.0 |
-0.006250 |
0.0 |
0.39500 |
0.441176 |
30.0 |
True |
-18.8 |
13.4 |
30.000 |
0.0 |
0 |
0.0 |
9 |
683 |
-2.119792 |
NaN |
| 2026-02-25 12:55:01+08:00 |
142 |
775 |
Ws_W75 |
1.510016 |
30.000000 |
775.02 |
775.000000 |
776.24 |
776.333333 |
2720.0 |
2880.0 |
73 |
0.0 |
-0.093750 |
0.0 |
0.43750 |
0.438356 |
32.0 |
True |
-1.2 |
5.6 |
32.193 |
0.0 |
0 |
0.0 |
9 |
210 |
-1.901042 |
NaN |