| 2026-02-26 08:17:32+08:00 |
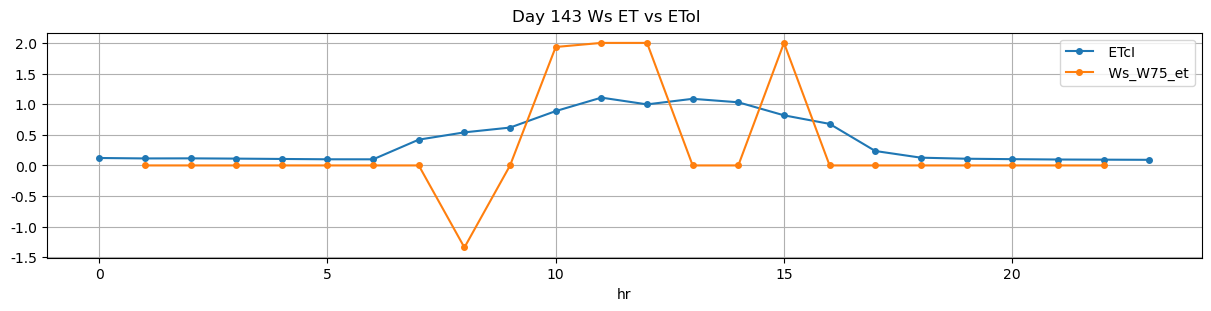
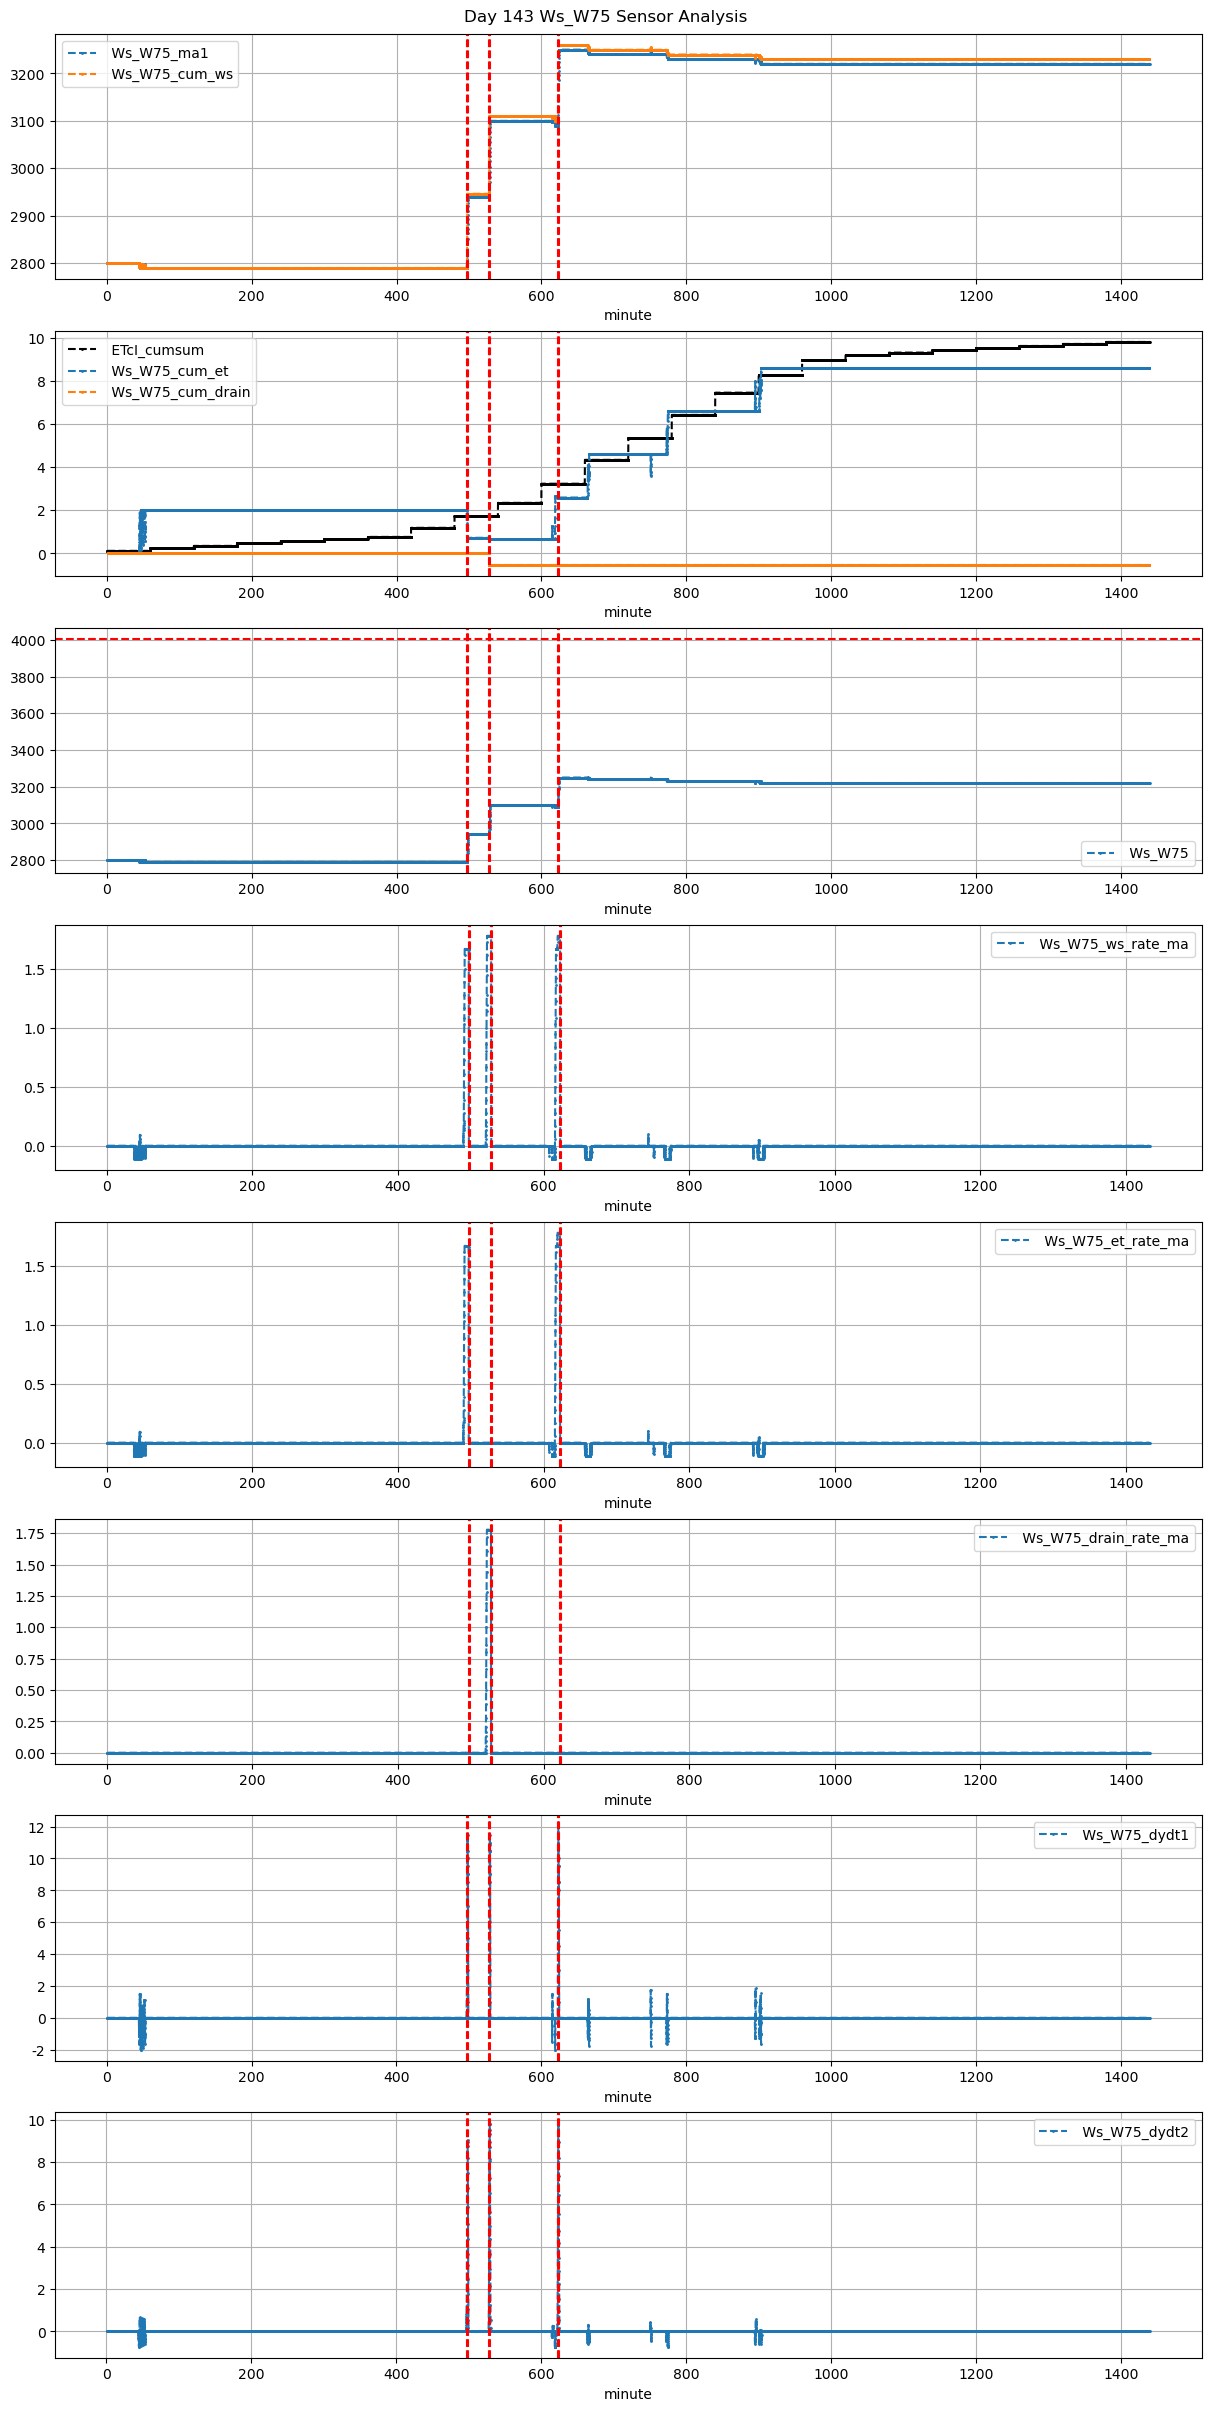
143 |
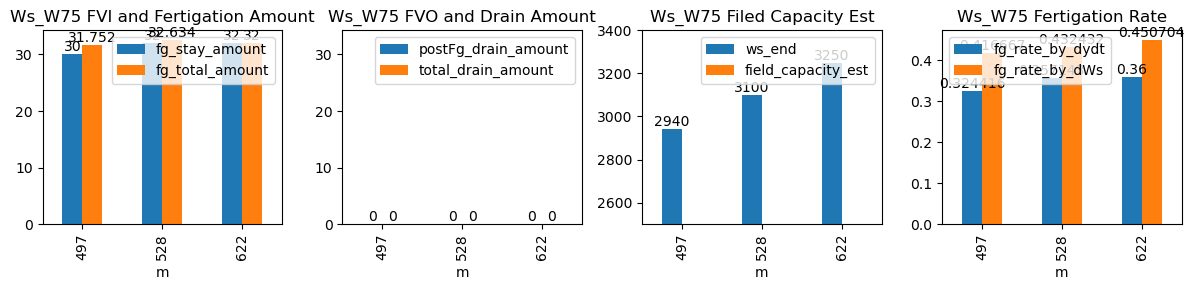
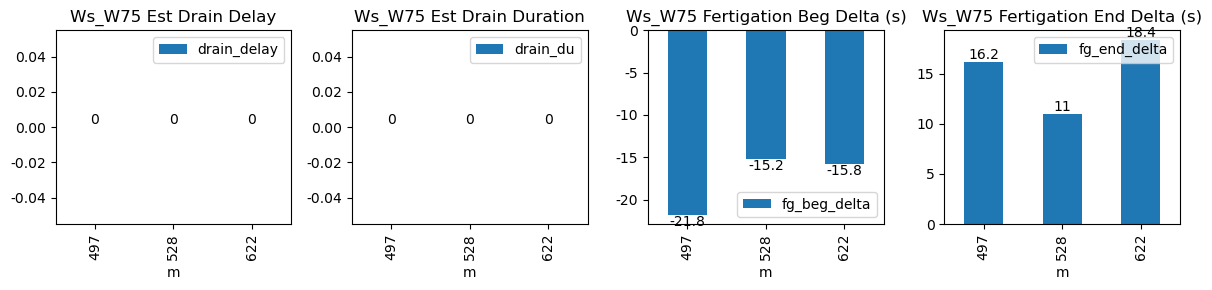
497 |
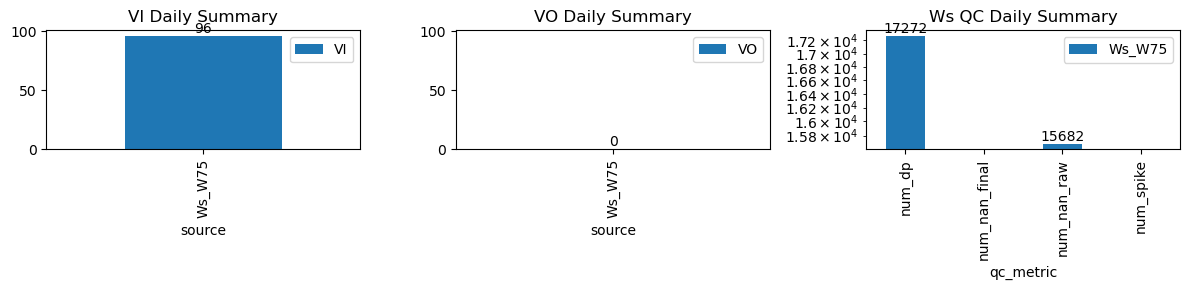
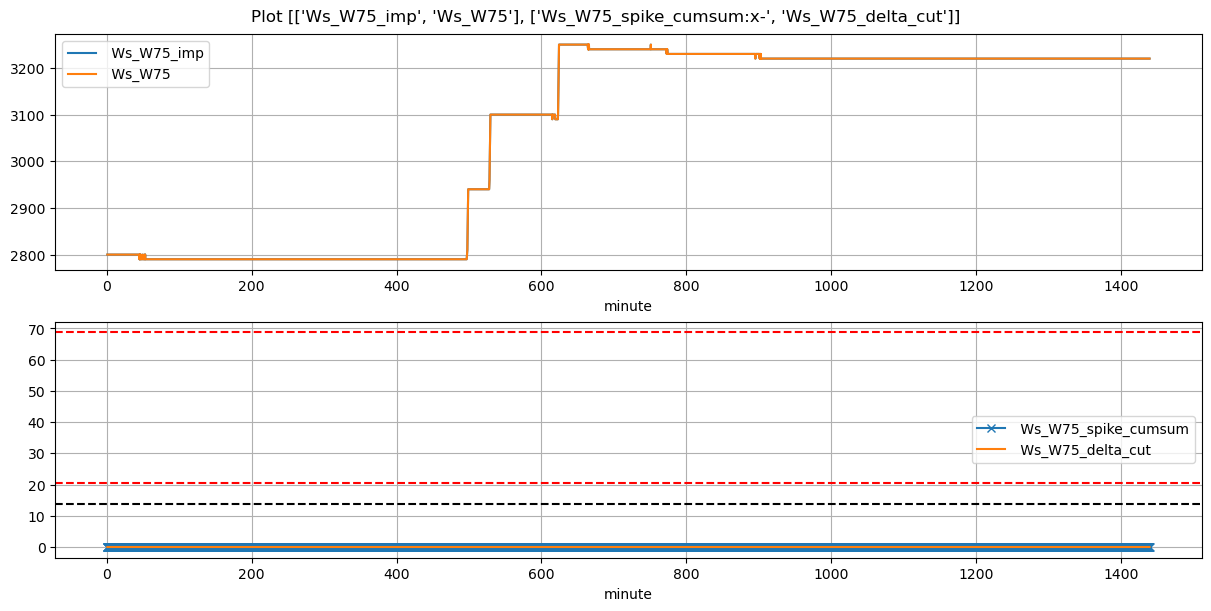
Ws_W75 |
0.923129 |
29.166667 |
497.53 |
497.166667 |
498.73 |
498.833333 |
2790.0 |
2940.0 |
72 |
0.000000 |
0.0 |
0.0 |
0.328571 |
0.416667 |
30.0 |
True |
-21.8 |
6.2 |
31.752 |
0.0 |
0 |
0.0 |
NaN |
NaN |
NaN |
NaN |
| 2026-02-26 08:48:10+08:00 |
143 |
528 |
Ws_W75 |
0.923129 |
30.000000 |
528.17 |
527.916667 |
529.40 |
529.416667 |
2940.0 |
3100.0 |
74 |
0.000000 |
0.0 |
0.0 |
0.363810 |
0.432432 |
32.0 |
True |
-15.2 |
1.0 |
32.634 |
0.0 |
0 |
0.0 |
NaN |
NaN |
NaN |
NaN |
| 2026-02-26 10:22:56+08:00 |
143 |
622 |
Ws_W75 |
0.923129 |
30.000000 |
622.93 |
622.666667 |
624.11 |
624.250000 |
3090.0 |
3250.0 |
71 |
-0.121469 |
0.0 |
0.0 |
0.364286 |
0.450704 |
32.0 |
True |
-15.8 |
8.4 |
32.000 |
0.0 |
0 |
0.0 |
NaN |
NaN |
NaN |
NaN |