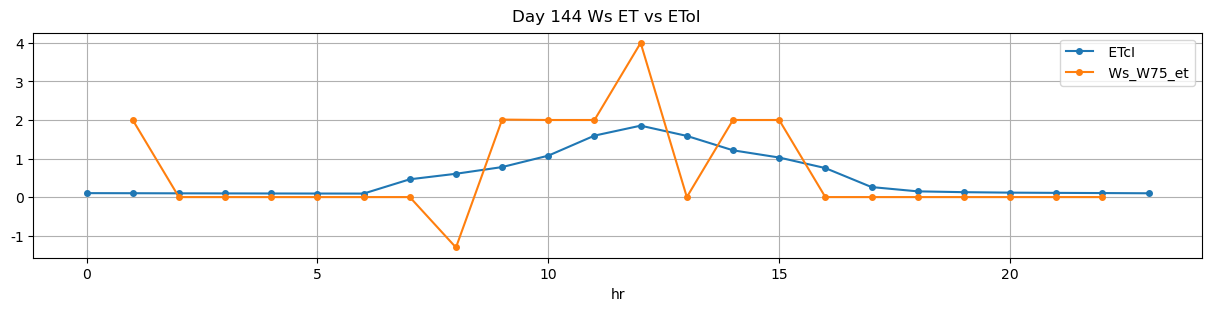
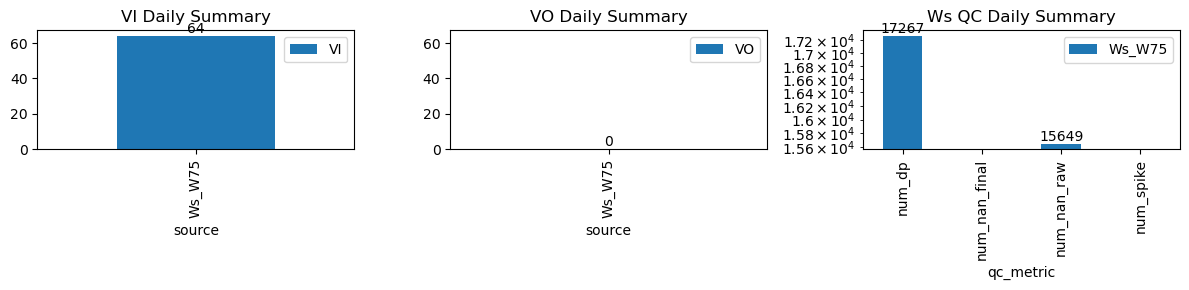
VI and VO Daily Summary
| ws_name | num_dp | num_nan_raw | num_nan_final | num_spike | cum_step_adj |
|---|---|---|---|---|---|
| Ws_W75 | 17,267 | 15,649 | 0 | 0 | 0.00 |
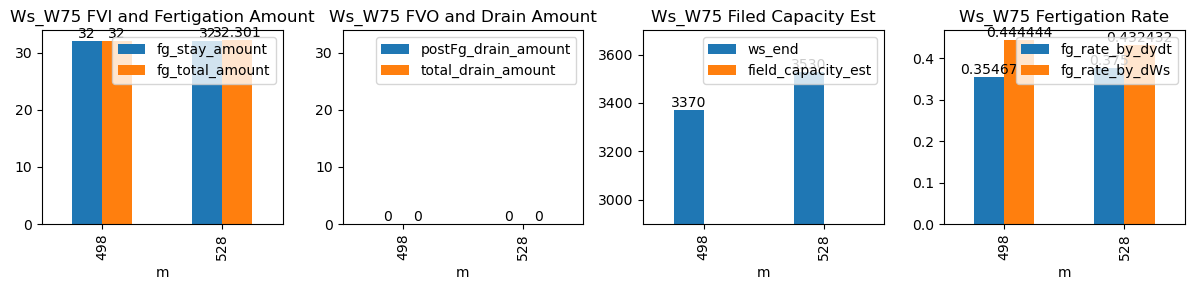
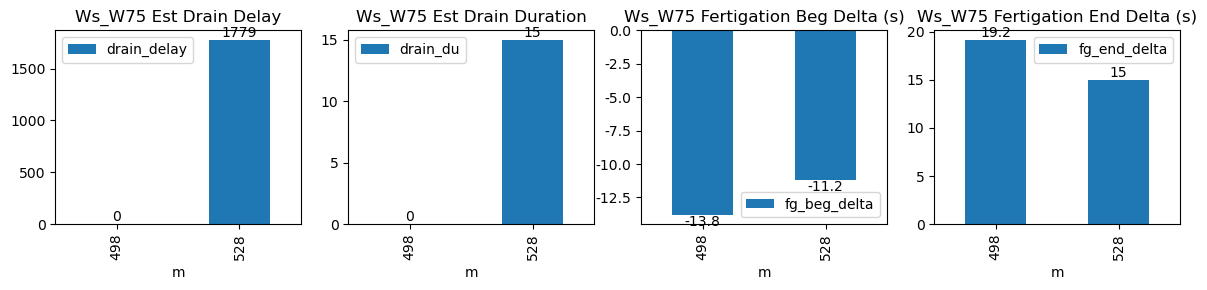
| ds | d | m | ws_name | prominence_cut | max_drain_du | fg_beg | fg_beg_est | fg_end | fg_end_est | ws_beg | ws_end | duc | pre_fg_et | post_fg_ws | post_drn_et | fg_rate_by_dydt | fg_rate_by_dWs | fg_stay_amount | enough_data | fg_beg_delta | fg_end_delta | fg_total_amount | fg_drain_amount | postFg_drain_amount | total_drain_amount | drain_du | drain_delay | drain_rate | field_capacity_est |
|---|---|---|---|---|---|---|---|---|---|---|---|---|---|---|---|---|---|---|---|---|---|---|---|---|---|---|---|---|---|
| 2026-02-27 08:18:44+08:00 | 144 | 498 | Ws_W75 | 1.15863 | 27.75 | 498.73 | 498.500000 | 499.93 | 500.25 | 3210.0 | 3370.0 | 72 | 0.000000 | 0.0 | 0.000000 | 0.35467 | 0.444444 | 32.0 | True | -13.8 | 19.2 | 32.000 | 0.0 | 0 | 0.0 | NaN | NaN | NaN | NaN |
| 2026-02-27 08:48:46+08:00 | 144 | 528 | Ws_W75 | 1.15863 | 30.00 | 528.77 | 528.583333 | 530.00 | 530.25 | 3370.0 | 3530.0 | 74 | -0.005408 | 0.0 | -0.017901 | 0.37500 | 0.432432 | 32.0 | True | -11.2 | 15.0 | 32.301 | 0.0 | 0 | 0.0 | 15.0 | 1779.0 | -0.093467 | NaN |