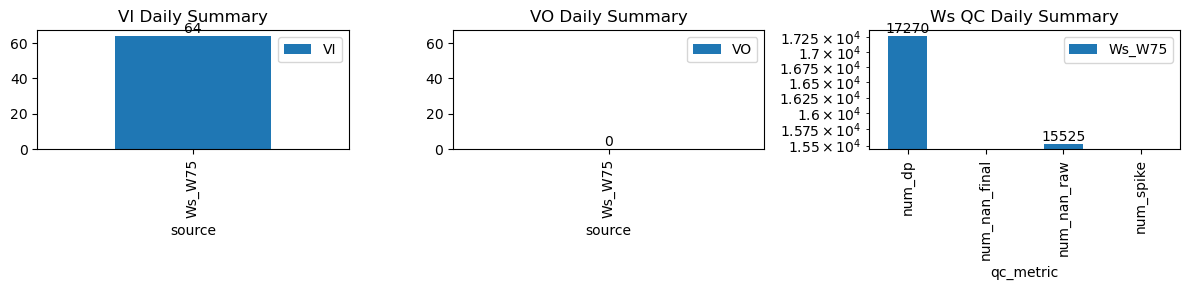
VI and VO Daily Summary
| ws_name | num_dp | num_nan_raw | num_nan_final | num_spike | cum_step_adj |
|---|---|---|---|---|---|
| Ws_W75 | 17,270 | 15,525 | 0 | 0 | 0.00 |
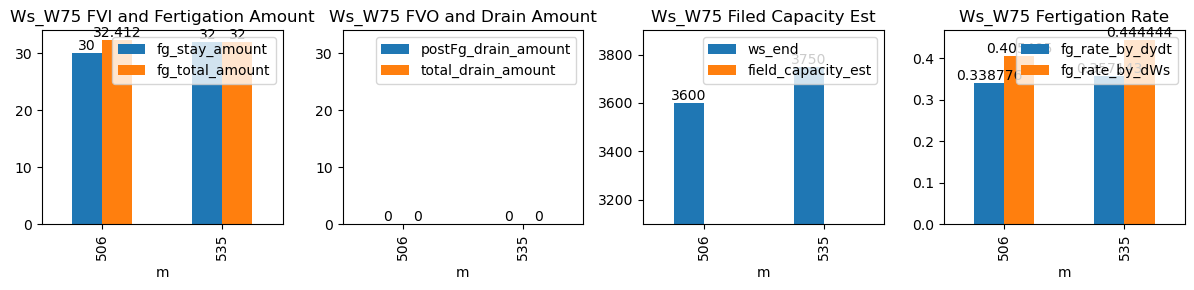
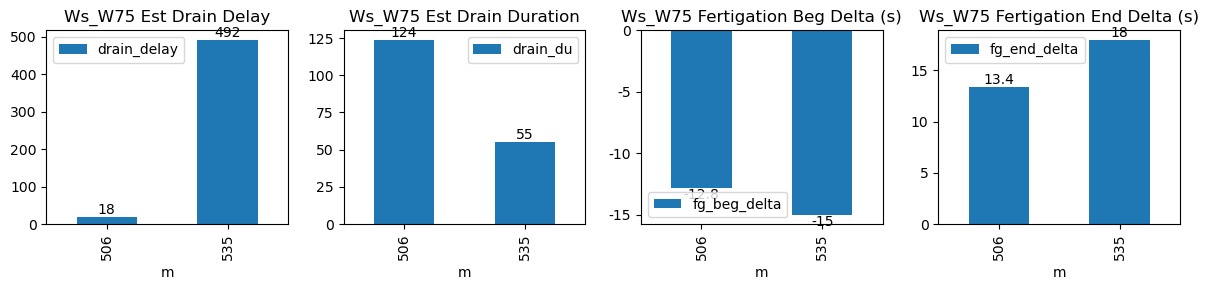
| ds | d | m | ws_name | prominence_cut | max_drain_du | fg_beg | fg_beg_est | fg_end | fg_end_est | ws_beg | ws_end | duc | pre_fg_et | post_fg_ws | post_drn_et | fg_rate_by_dydt | fg_rate_by_dWs | fg_stay_amount | enough_data | fg_beg_delta | fg_end_delta | fg_total_amount | fg_drain_amount | postFg_drain_amount | total_drain_amount | drain_du | drain_delay | drain_rate | field_capacity_est |
|---|---|---|---|---|---|---|---|---|---|---|---|---|---|---|---|---|---|---|---|---|---|---|---|---|---|---|---|---|---|
| 2026-02-28 08:26:08+08:00 | 145 | 506 | Ws_W75 | 1.124107 | 27.416667 | 506.13 | 505.916667 | 507.36 | 507.583333 | 3450.0 | 3600.0 | 74 | 0.000000 | -0.024691 | 0.000000e+00 | 0.338776 | 0.405405 | 30.0 | True | -12.8 | 13.4 | 32.412 | 0.0 | 0.0 | 0.0 | 124 | 18 | -0.111048 | NaN |
| 2026-02-28 08:55:00+08:00 | 145 | 535 | Ws_W75 | 1.124107 | 30.000000 | 535.00 | 534.750000 | 536.20 | 536.500000 | 3590.0 | 3750.0 | 72 | -0.009352 | -0.095062 | -5.052748e-15 | 0.357143 | 0.444444 | 32.0 | True | -15.0 | 18.0 | 32.000 | 0.0 | 0.0 | 0.0 | 55 | 492 | -0.104215 | NaN |