| 2026-03-30 08:12:23+08:00 |
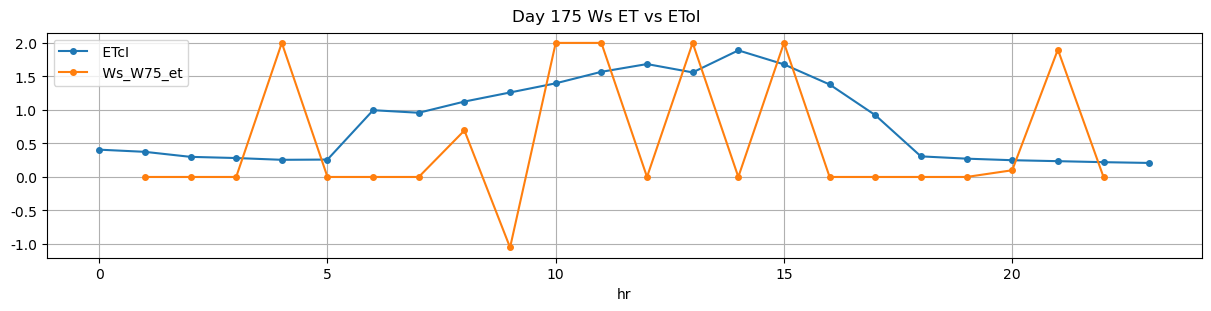
175 |
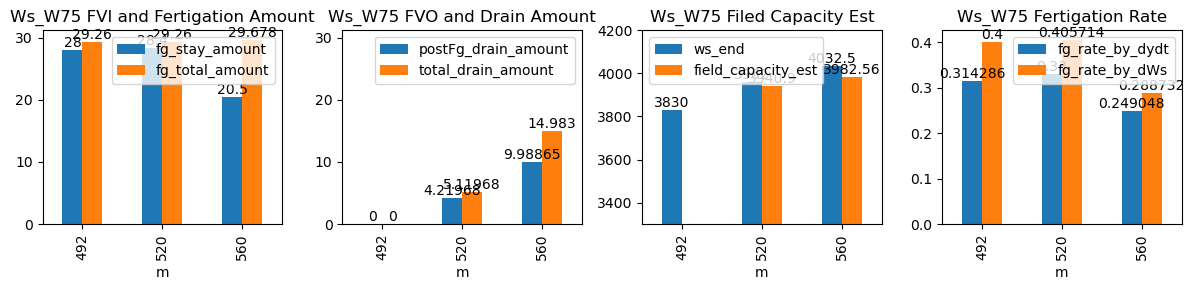
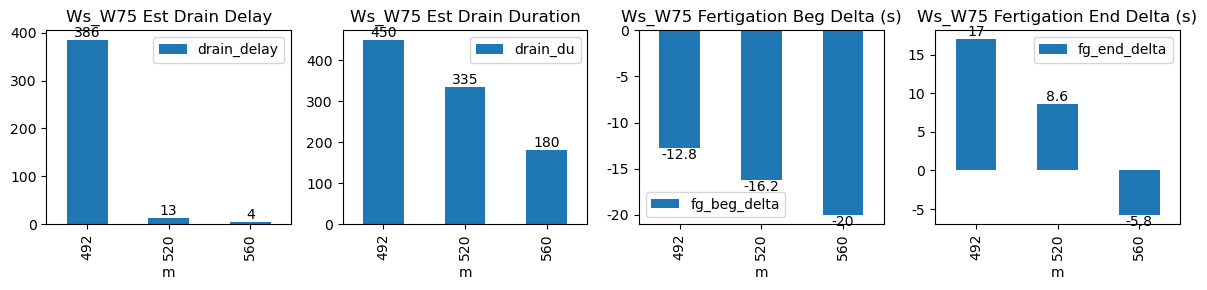
492 |
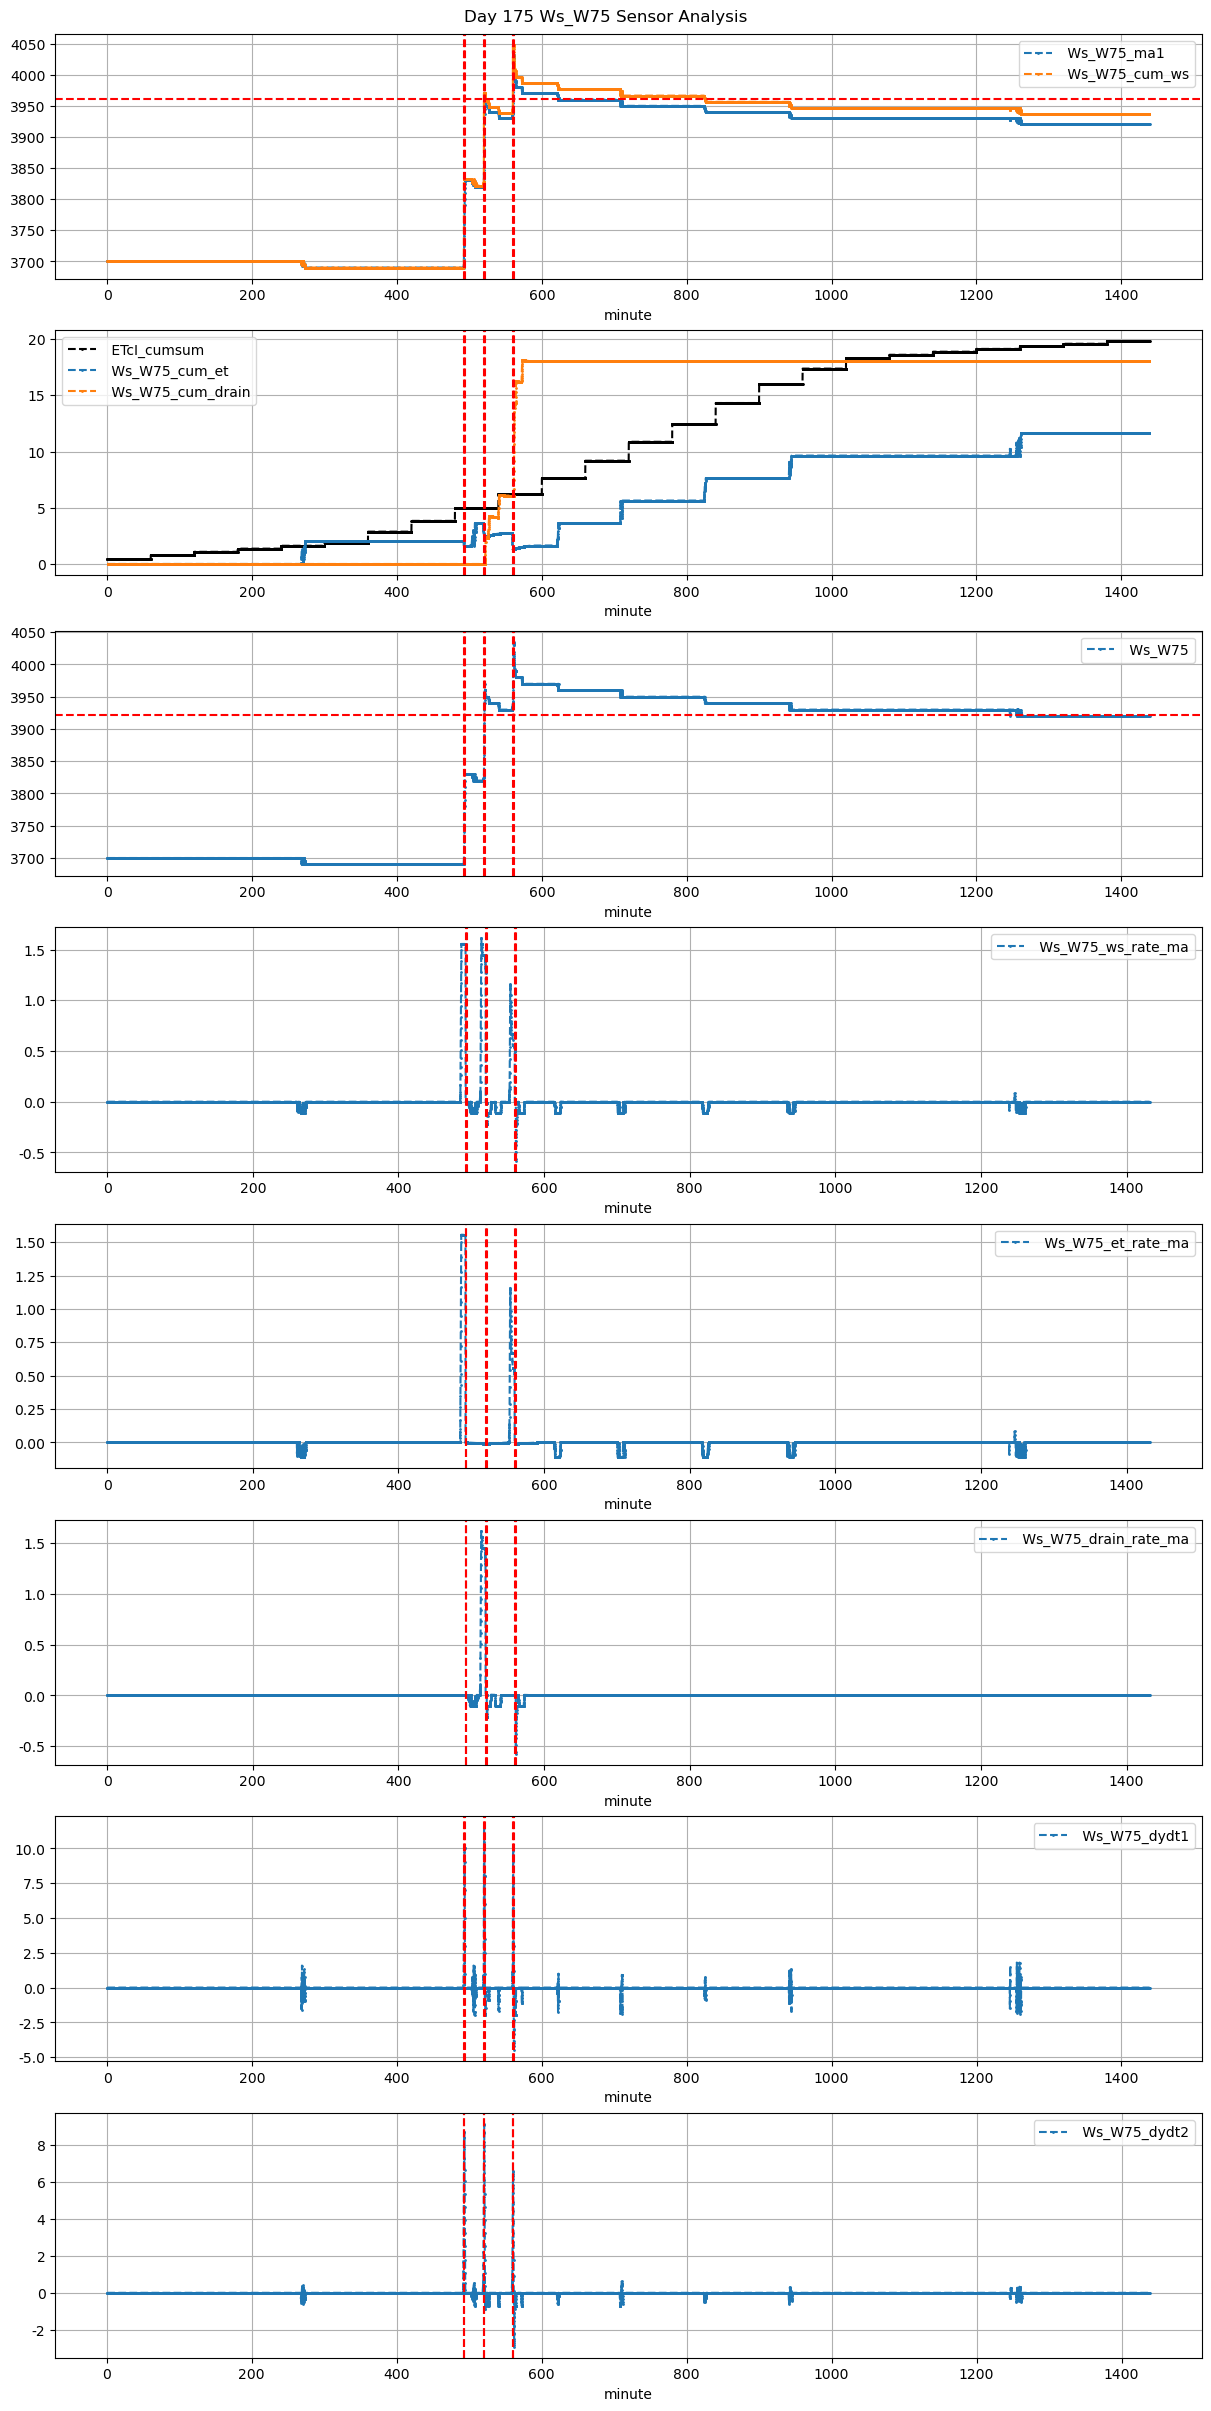
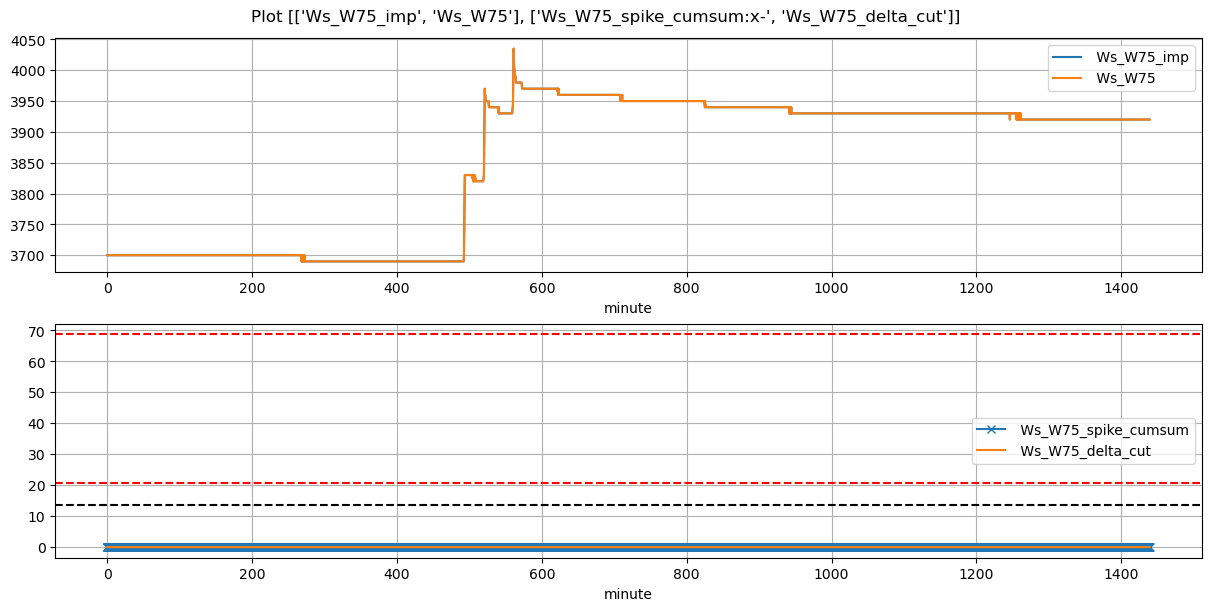
Ws_W75 |
1.317281 |
26.333333 |
492.38 |
492.166667 |
493.55 |
493.666667 |
3690.0 |
3830.0 |
70 |
0.0 |
-0.000694 |
0.0 |
0.322143 |
0.400000 |
28.0 |
True |
-12.8 |
7.0 |
30.030 |
0.000 |
0.00 |
0.000 |
30 |
817 |
-1.720833 |
NaN |
| 2026-03-30 08:40:01+08:00 |
175 |
520 |
Ws_W75 |
1.317281 |
30.000000 |
520.02 |
519.750000 |
521.19 |
521.250000 |
3820.0 |
3970.0 |
70 |
0.0 |
-0.190025 |
0.0 |
0.333810 |
0.428571 |
30.0 |
True |
-16.2 |
3.6 |
30.030 |
0.000 |
0.00 |
0.000 |
30 |
53 |
-1.850000 |
NaN |
| 2026-03-30 09:20:00+08:00 |
175 |
560 |
Ws_W75 |
1.317281 |
30.000000 |
560.00 |
559.666667 |
561.18 |
561.083333 |
3930.0 |
4035.0 |
71 |
0.0 |
-0.175926 |
0.0 |
0.249048 |
0.295775 |
21.0 |
True |
-20.0 |
-5.8 |
30.459 |
6.125 |
12.25 |
18.375 |
75 |
14 |
-4.033333 |
3973.75 |