| 2026-03-31 08:11:23+08:00 |
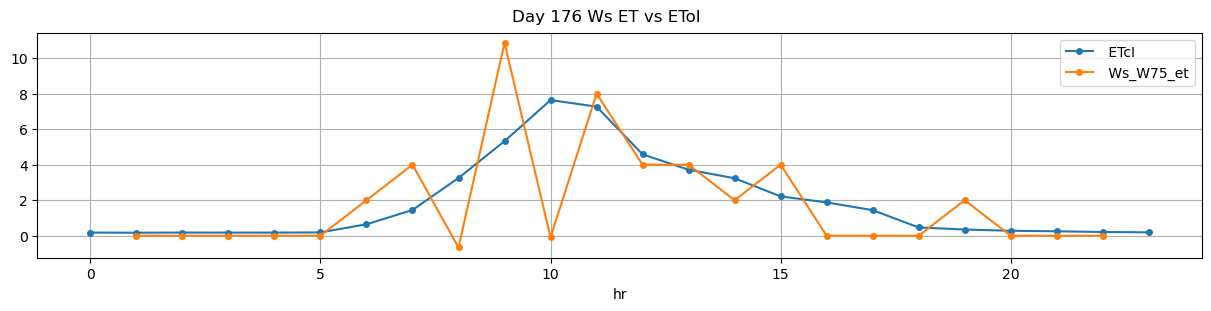
176 |
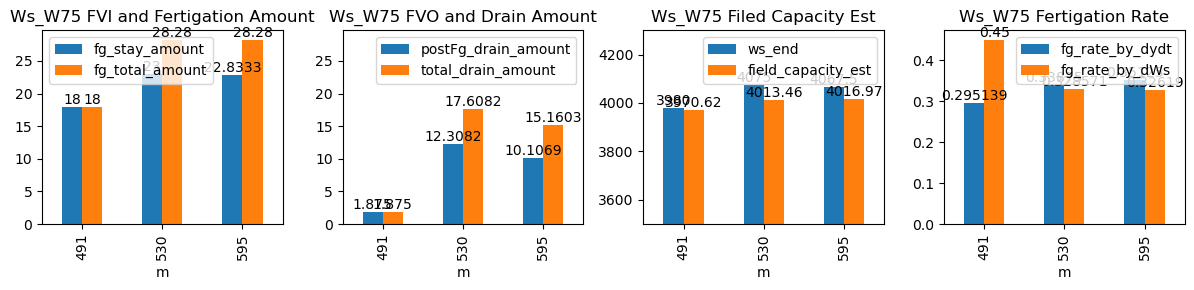
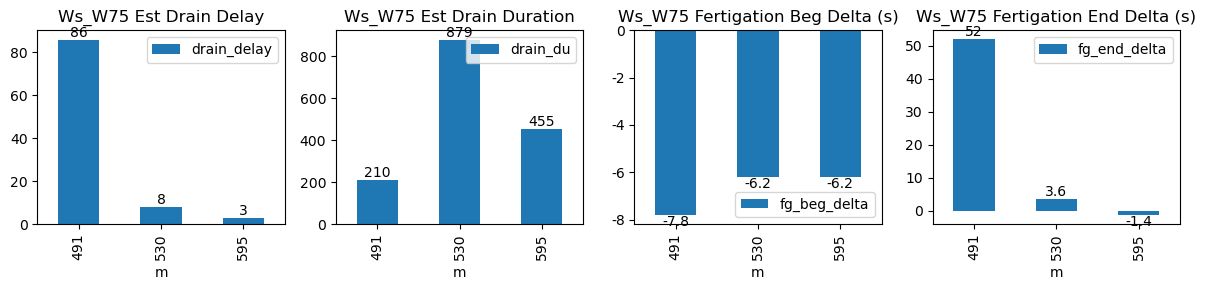
491 |
Ws_W75 |
3.286837 |
30 |
491.38 |
491.250000 |
492.05 |
492.750000 |
3890.000000 |
3980.0 |
40 |
0.000000 |
-0.138802 |
0.000000 |
0.300208 |
0.450000 |
18.000000 |
True |
-7.8 |
42.0 |
18.00 |
0.0 |
0.000000 |
0.000000 |
20 |
286 |
-2.187500 |
NaN |
| 2026-03-31 08:50:01+08:00 |
176 |
530 |
Ws_W75 |
3.286837 |
30 |
530.02 |
529.916667 |
531.19 |
531.166667 |
3960.000000 |
4080.0 |
70 |
0.000000 |
-0.247222 |
-0.057407 |
0.340625 |
0.342857 |
24.000000 |
True |
-6.2 |
-1.4 |
28.28 |
4.3 |
14.927593 |
19.227593 |
80 |
13 |
-3.889588 |
4005.362037 |
| 2026-03-31 09:55:01+08:00 |
176 |
595 |
Ws_W75 |
3.286837 |
30 |
595.02 |
594.916667 |
596.19 |
596.166667 |
3952.133333 |
4070.0 |
70 |
-0.076648 |
-0.251852 |
-0.131944 |
0.351250 |
0.336762 |
23.573333 |
True |
-6.2 |
-1.4 |
28.28 |
0.0 |
0.000000 |
0.000000 |
45 |
8 |
-5.037421 |
NaN |