| 2026-03-19 08:22:45+08:00 |
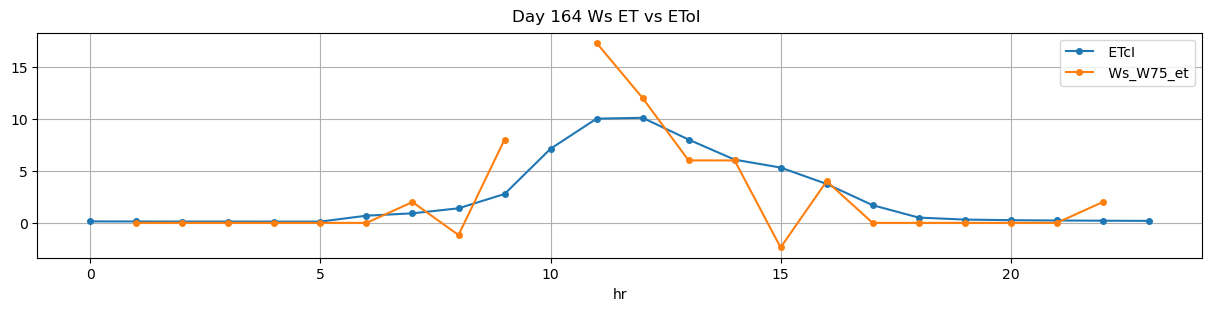
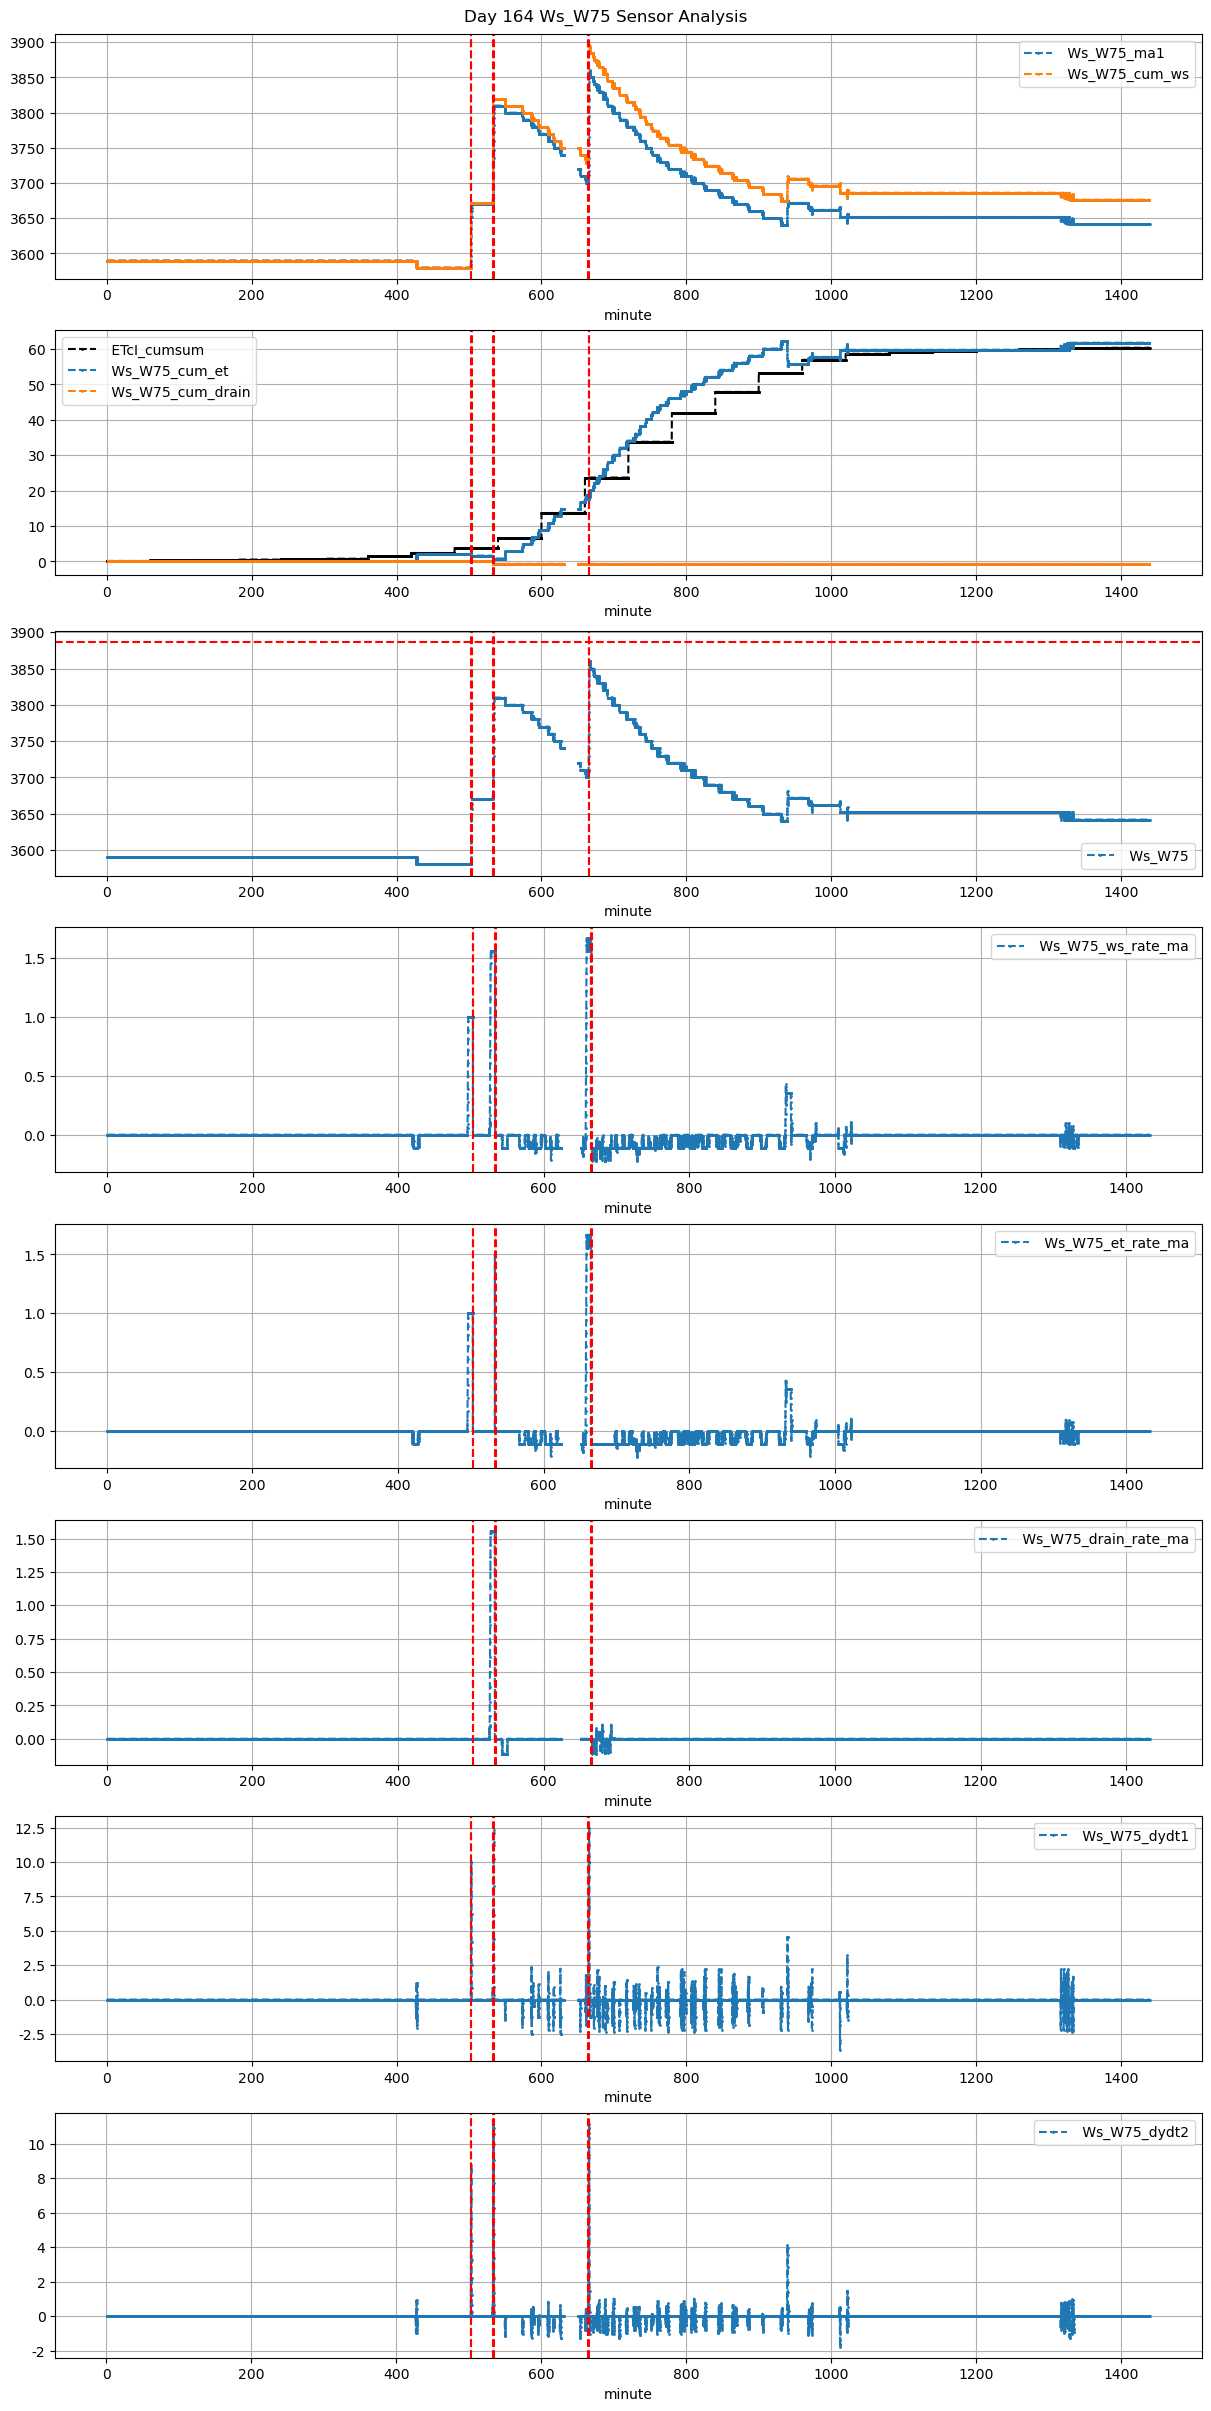
164 |
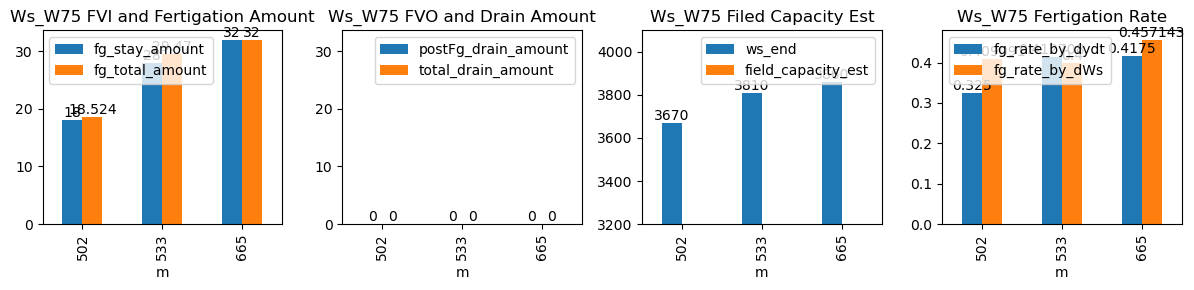
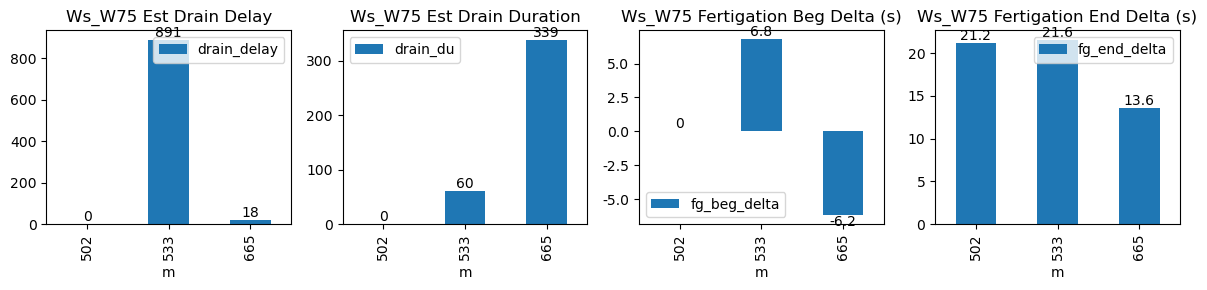
502 |
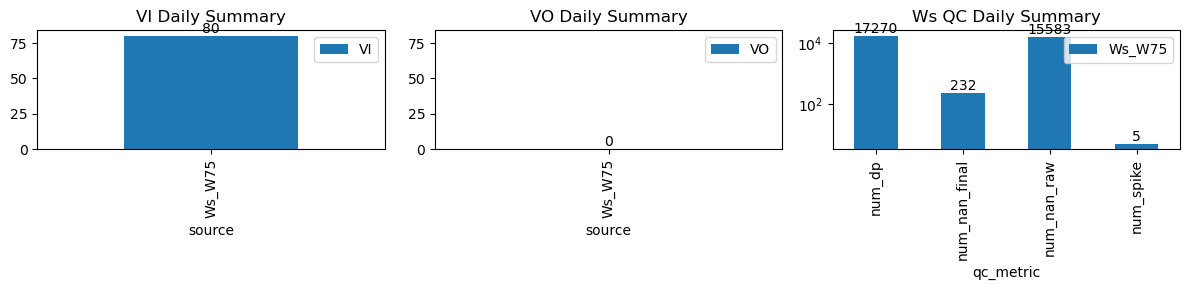
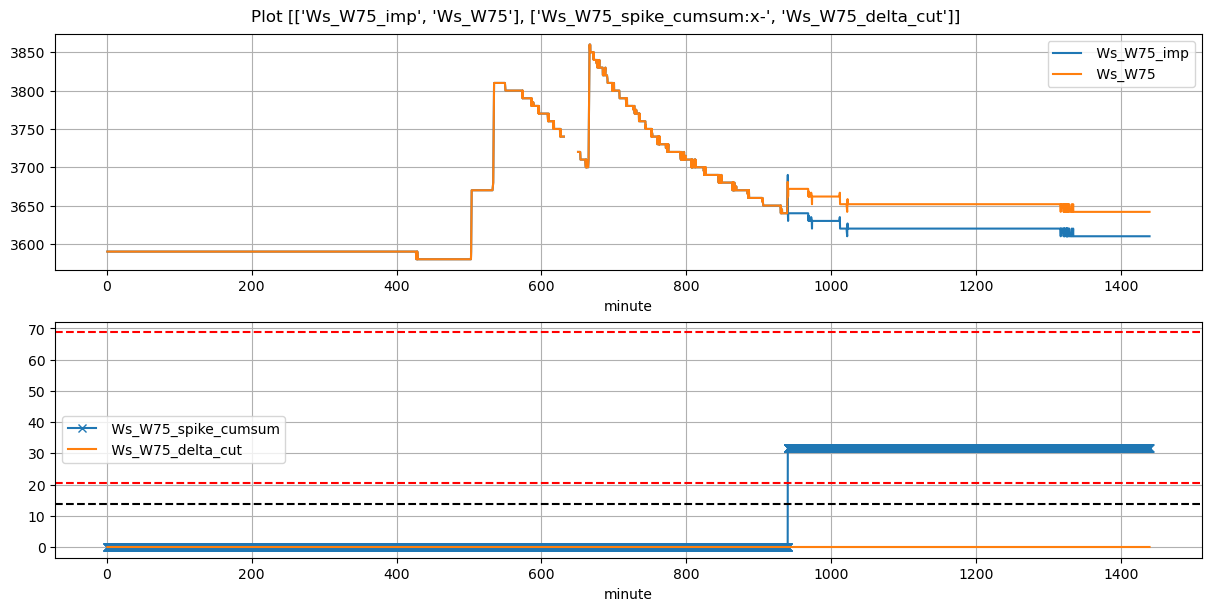
Ws_W75 |
1.635887 |
29.166667 |
502.75 |
502.750000 |
503.48 |
503.833333 |
3580.0 |
3670.0 |
44 |
0.000000 |
0.000000 |
0.000000e+00 |
0.325000 |
0.409091 |
18.0 |
True |
0.0 |
21.2 |
18.524 |
0.0 |
0 |
0.0 |
NaN |
NaN |
NaN |
NaN |
| 2026-03-19 08:53:13+08:00 |
164 |
533 |
Ws_W75 |
1.635887 |
30.000000 |
533.22 |
533.333333 |
534.39 |
534.750000 |
3670.0 |
3810.0 |
70 |
-0.019250 |
-0.000077 |
-5.052748e-15 |
0.412708 |
0.400000 |
28.0 |
True |
6.8 |
21.6 |
29.470 |
0.0 |
0 |
0.0 |
60.0 |
891.0 |
-0.111071 |
NaN |
| 2026-03-19 11:05:01+08:00 |
164 |
665 |
Ws_W75 |
1.635887 |
30.000000 |
665.02 |
664.916667 |
666.19 |
666.416667 |
3700.0 |
3860.0 |
70 |
-0.109836 |
-0.142901 |
-1.132716e-01 |
0.417500 |
0.457143 |
32.0 |
True |
-6.2 |
13.6 |
32.000 |
0.0 |
0 |
0.0 |
339.0 |
18.0 |
-0.110328 |
NaN |