| 2026-03-07 08:07:28+08:00 |
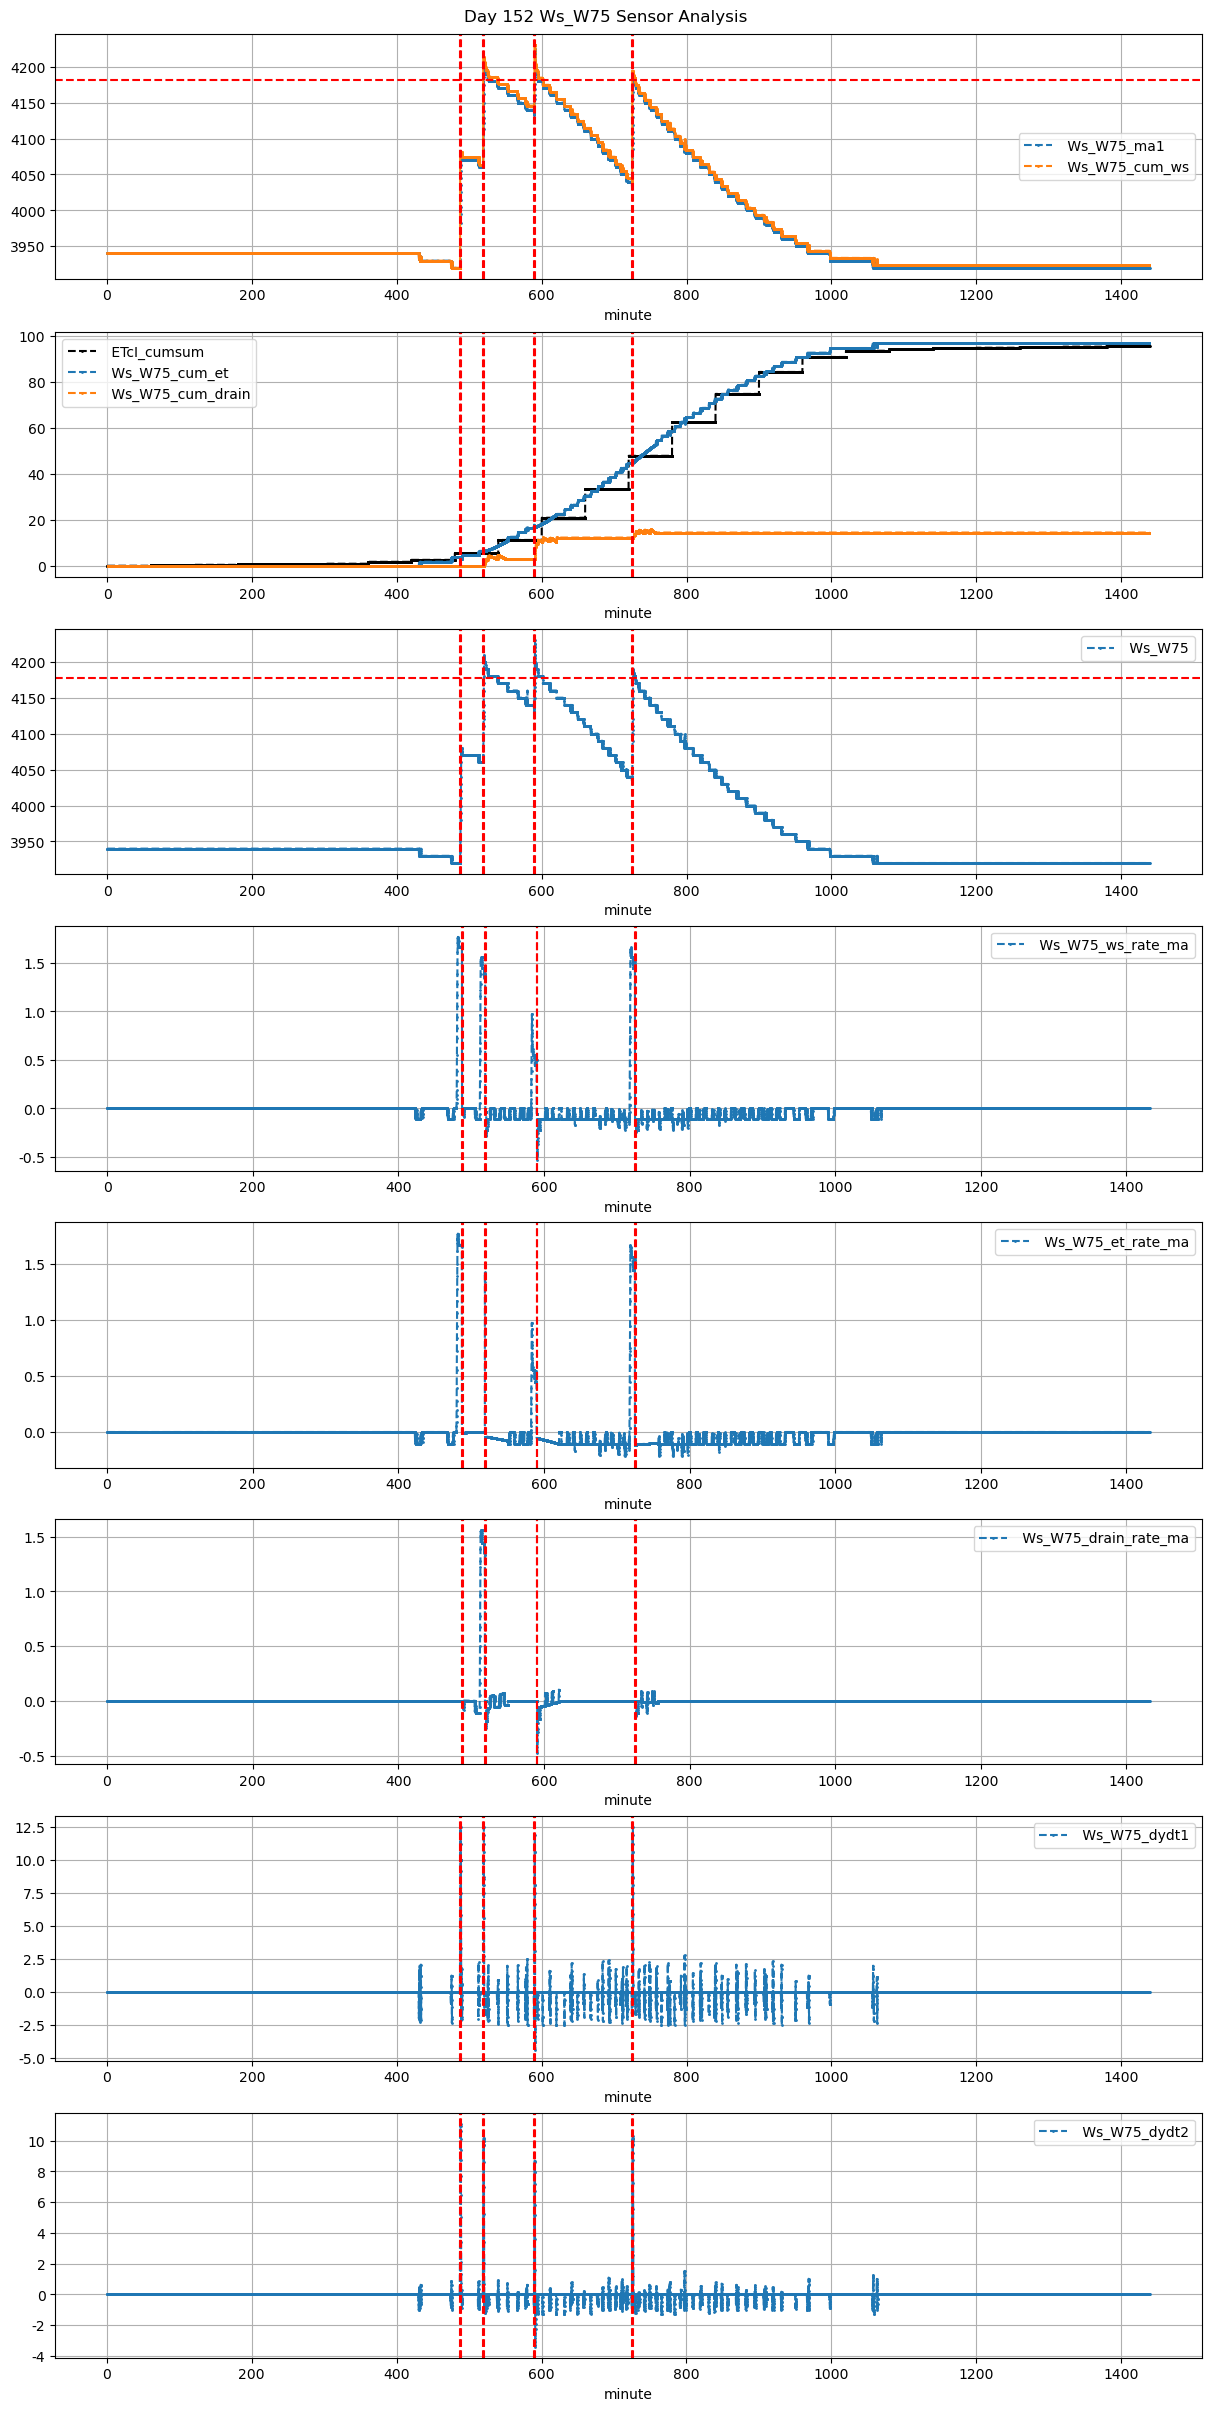
152 |
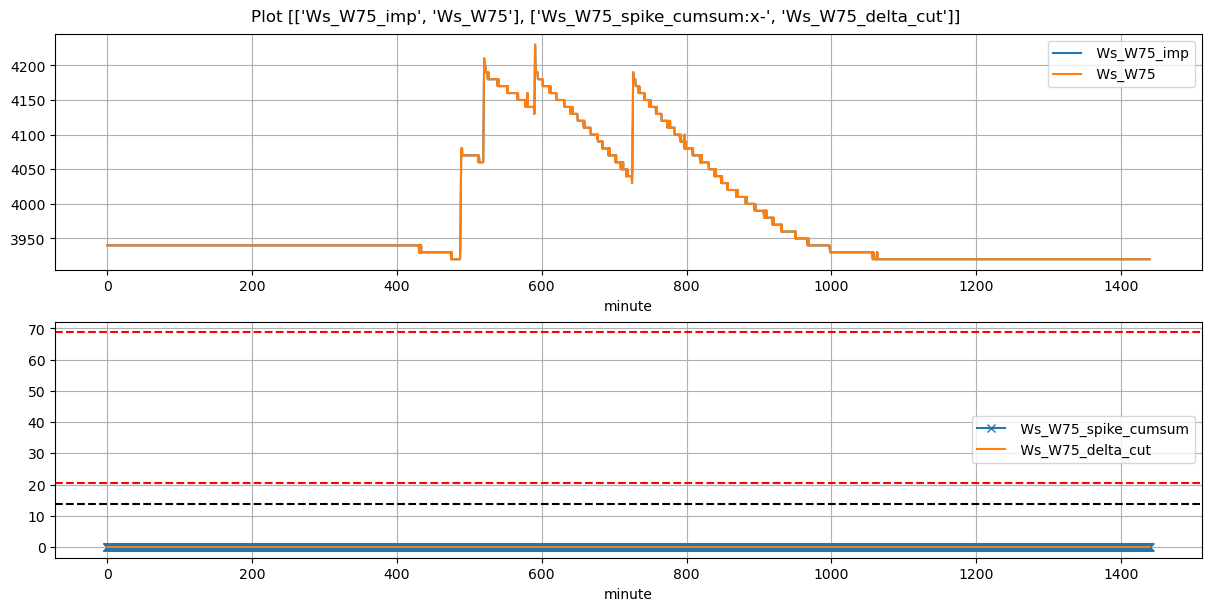
487 |
Ws_W75 |
1.910222 |
30 |
487.47 |
487.416667 |
488.65 |
488.916667 |
3920.0 |
4080.0 |
71 |
0.000000 |
-0.020370 |
0.000000 |
0.416250 |
0.450704 |
32.0 |
True |
-3.2 |
16.0 |
32.000 |
0.0 |
0.000000 |
0.000000 |
10 |
26 |
-1.375000 |
NaN |
| 2026-03-07 08:39:17+08:00 |
152 |
519 |
Ws_W75 |
1.910222 |
30 |
519.28 |
519.250000 |
520.46 |
520.500000 |
4060.0 |
4210.0 |
71 |
-0.138418 |
-0.226389 |
-0.084722 |
0.400000 |
0.422535 |
30.0 |
True |
-1.8 |
2.4 |
31.524 |
0.0 |
0.000000 |
0.000000 |
10 |
297 |
-2.021073 |
NaN |
| 2026-03-07 09:50:00+08:00 |
152 |
590 |
Ws_W75 |
1.910222 |
30 |
590.00 |
589.916667 |
590.68 |
590.833333 |
4140.0 |
4230.0 |
41 |
-0.016478 |
-0.190972 |
-0.151389 |
0.318750 |
0.439024 |
18.0 |
True |
-5.0 |
9.2 |
18.204 |
0.2 |
8.990353 |
9.190353 |
75 |
19 |
-3.731774 |
4185.048234 |
| 2026-03-07 12:05:01+08:00 |
152 |
725 |
Ws_W75 |
1.910222 |
30 |
725.02 |
725.000000 |
726.20 |
726.250000 |
4040.0 |
4190.0 |
71 |
-0.085687 |
-0.200000 |
-0.100000 |
0.404167 |
0.422535 |
30.0 |
True |
-1.2 |
3.0 |
31.524 |
0.0 |
0.000000 |
0.000000 |
9 |
517 |
-1.781887 |
NaN |