| 2026-03-08 08:07:38+08:00 |
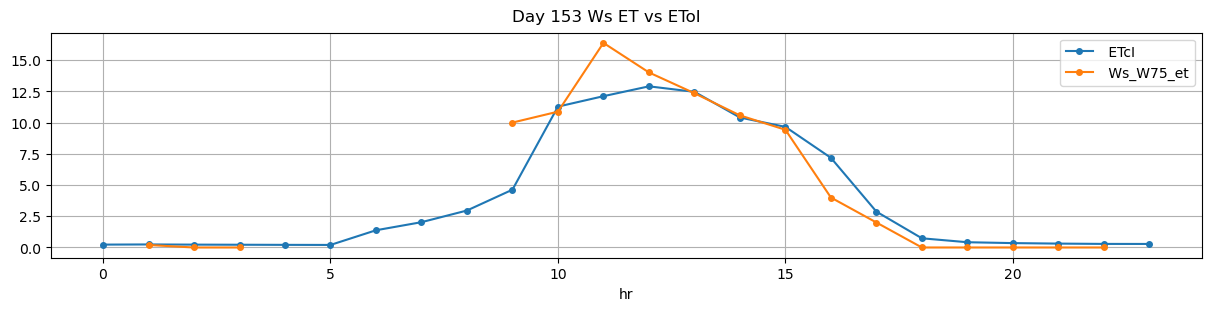
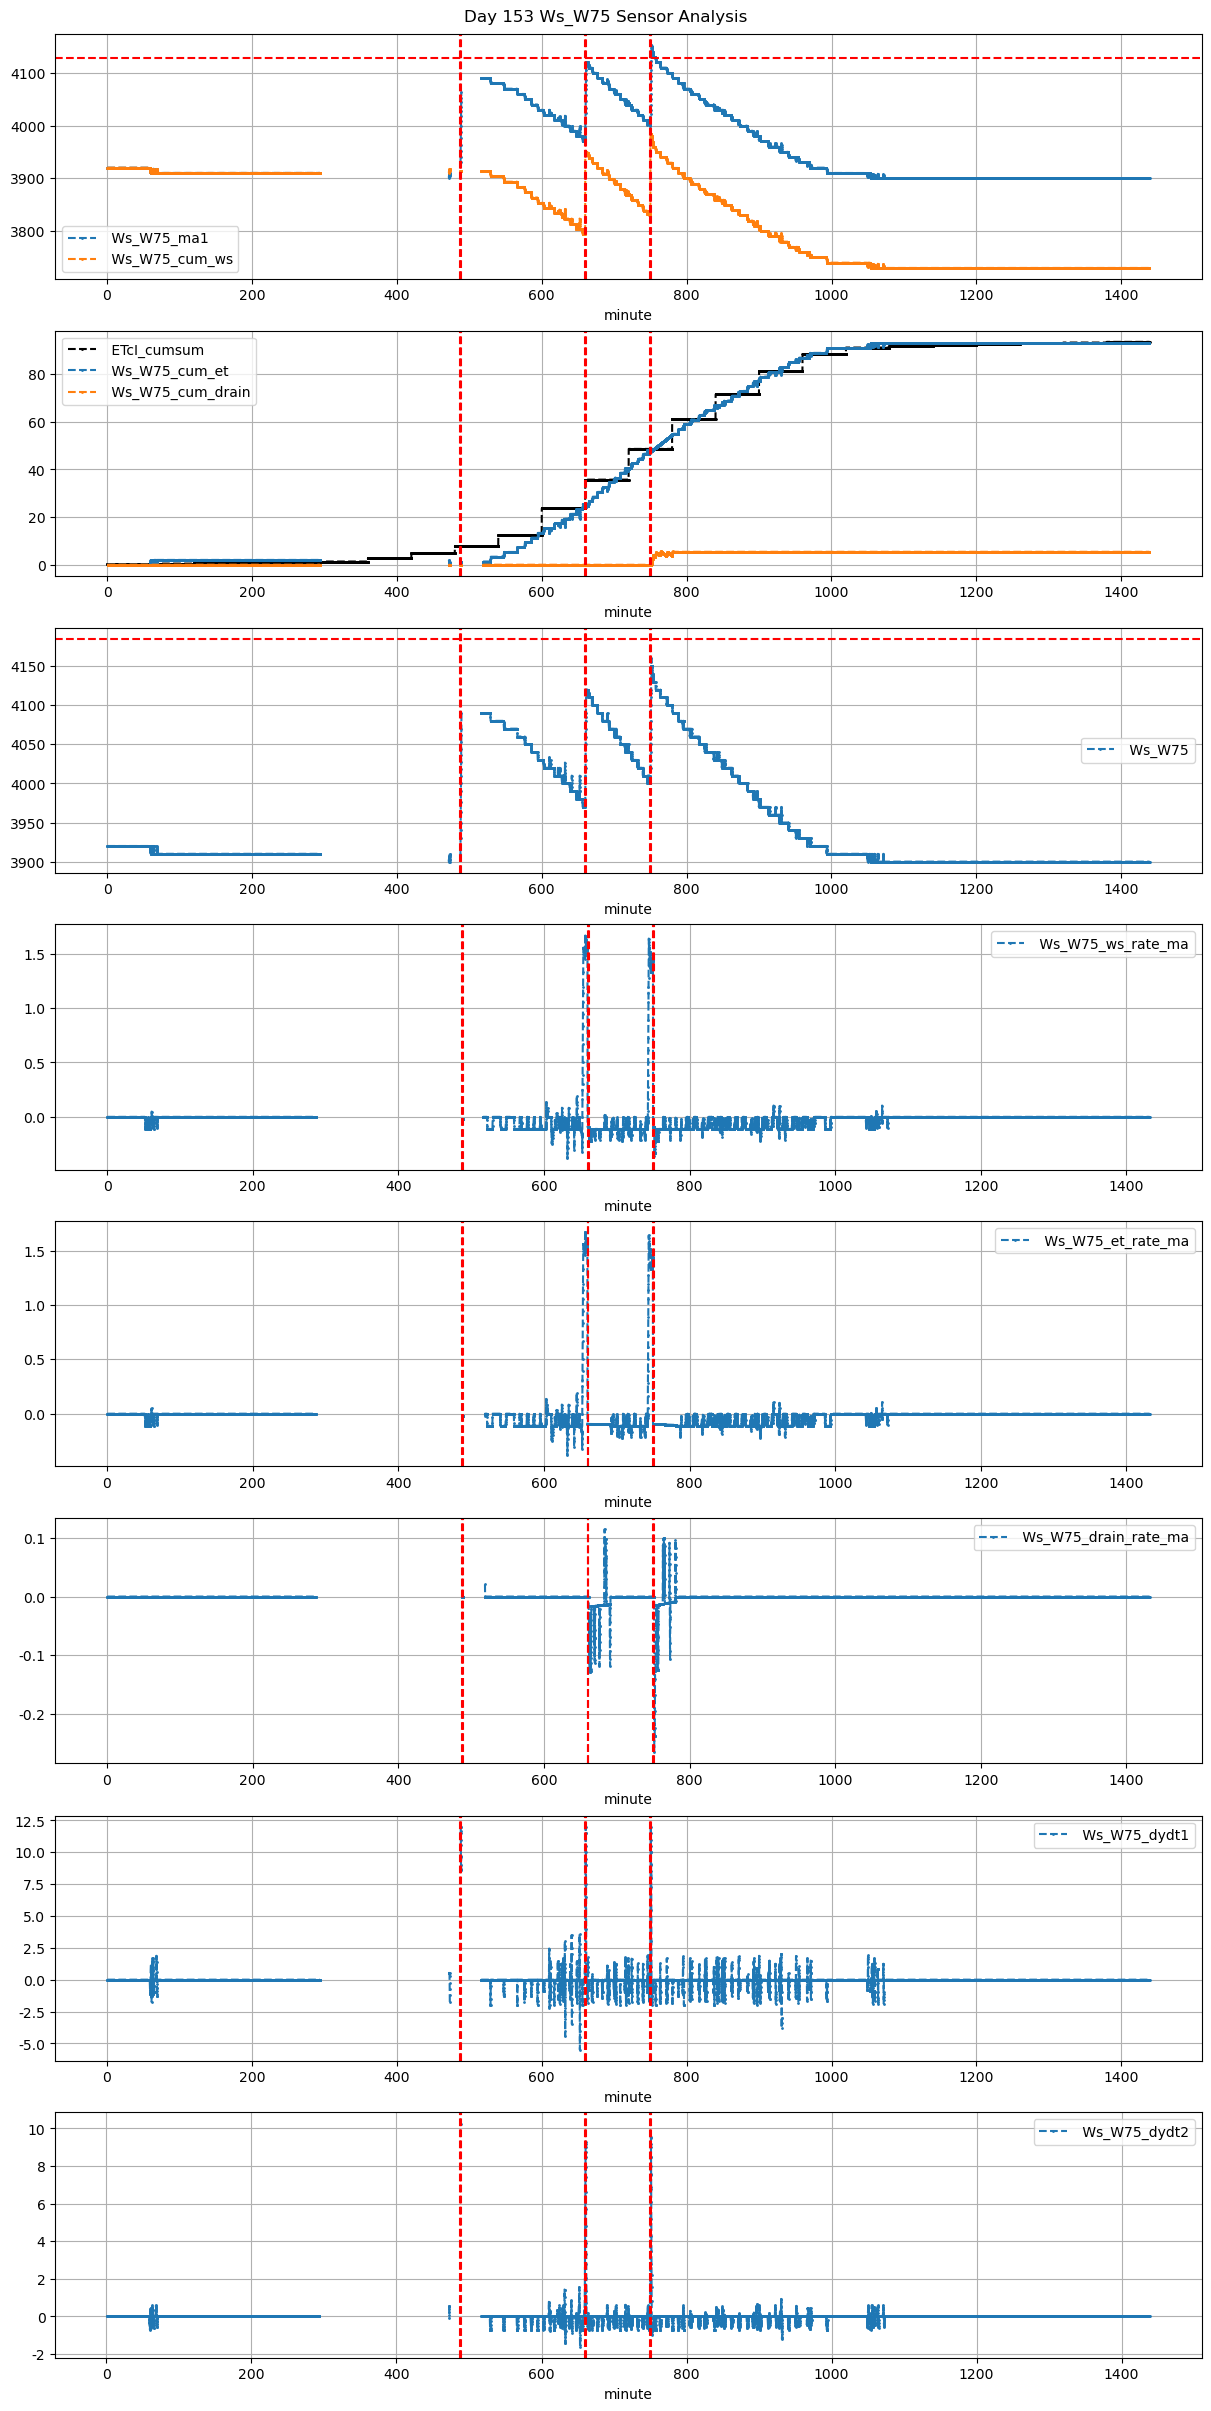
153 |
487 |
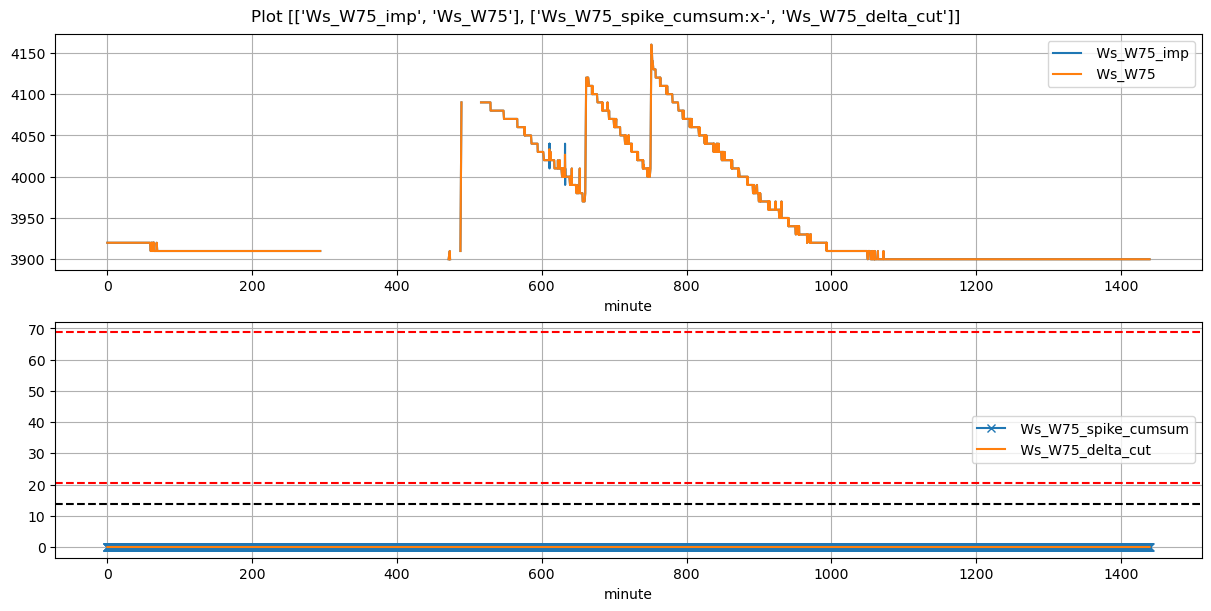
Ws_W75 |
1.22895 |
30 |
487.63 |
NaN |
489.16 |
489.000000 |
NaN |
4063.714286 |
92 |
-0.020559 |
NaN |
-0.020559 |
NaN |
-0.000223 |
-0.020559 |
False |
NaN |
-9.6 |
NaN |
0.0 |
0.000000 |
0.000000 |
NaN |
NaN |
NaN |
NaN |
| 2026-03-08 11:00:01+08:00 |
153 |
660 |
Ws_W75 |
1.22895 |
30 |
660.02 |
659.75 |
661.22 |
661.416667 |
3970.000000 |
4120.000000 |
72 |
-0.094286 |
-0.145139 |
-0.098148 |
0.339286 |
0.416667 |
30.000000 |
True |
-16.2 |
11.8 |
31.608 |
0.0 |
0.000000 |
0.000000 |
1205.0 |
86.0 |
-0.116456 |
NaN |
| 2026-03-08 12:30:01+08:00 |
153 |
750 |
Ws_W75 |
1.22895 |
30 |
750.02 |
749.75 |
751.19 |
751.416667 |
4004.327273 |
4153.000000 |
70 |
-0.095846 |
-0.177778 |
-0.103086 |
0.339286 |
0.424779 |
29.734545 |
True |
-16.2 |
13.6 |
30.730 |
1.0 |
4.877018 |
5.877018 |
705.0 |
18.0 |
-0.126048 |
4128.614912 |