| 2026-03-06 08:12:06+08:00 |
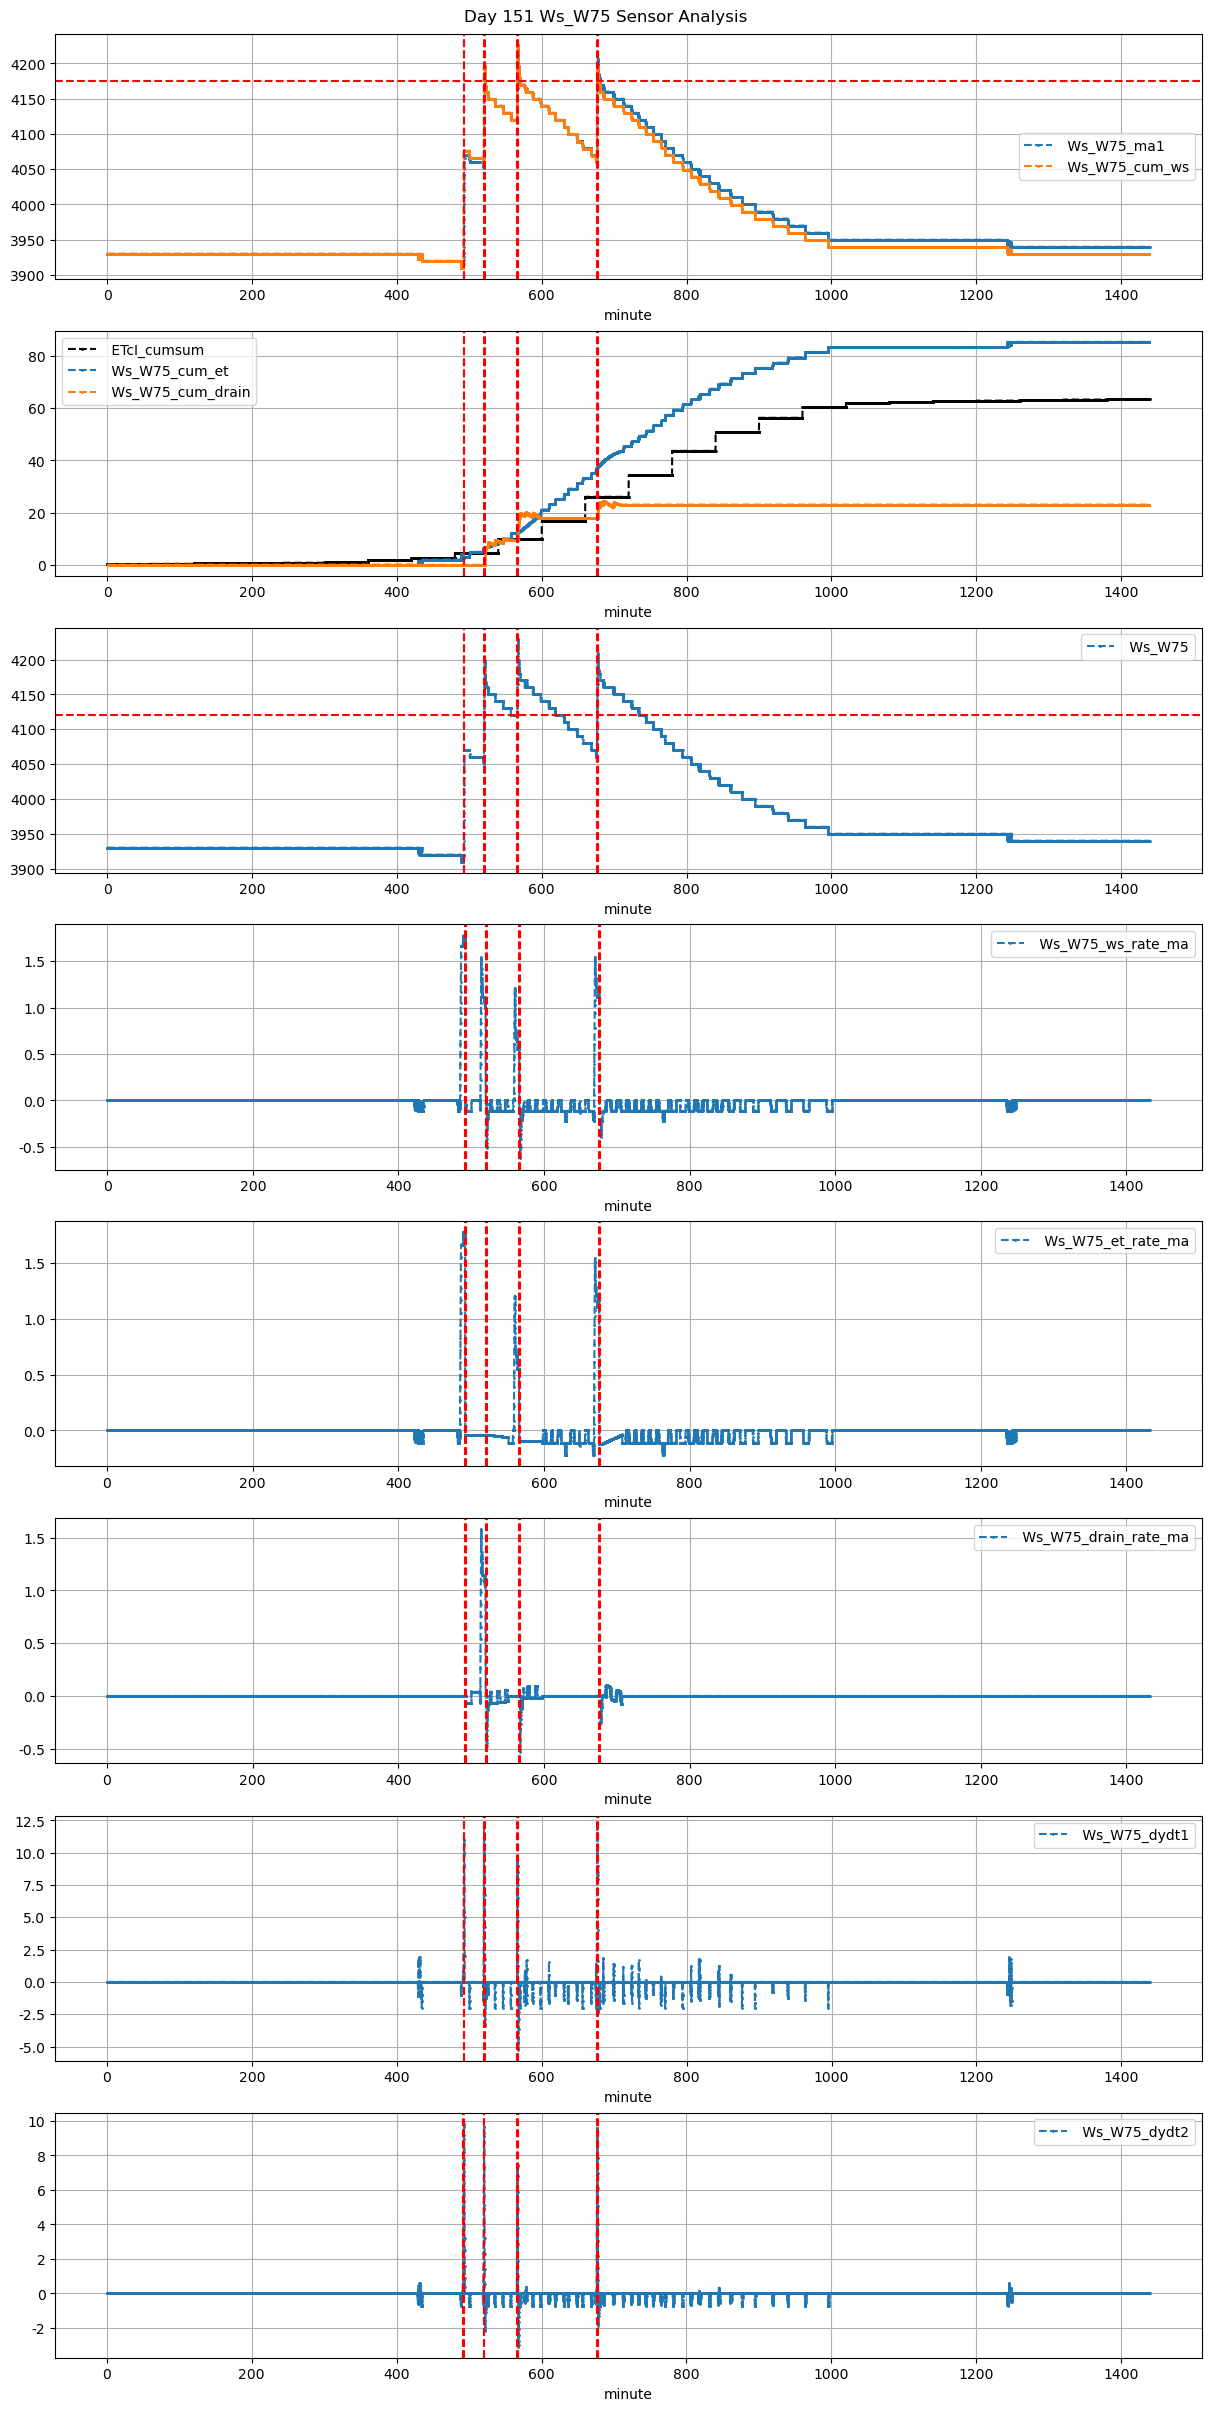
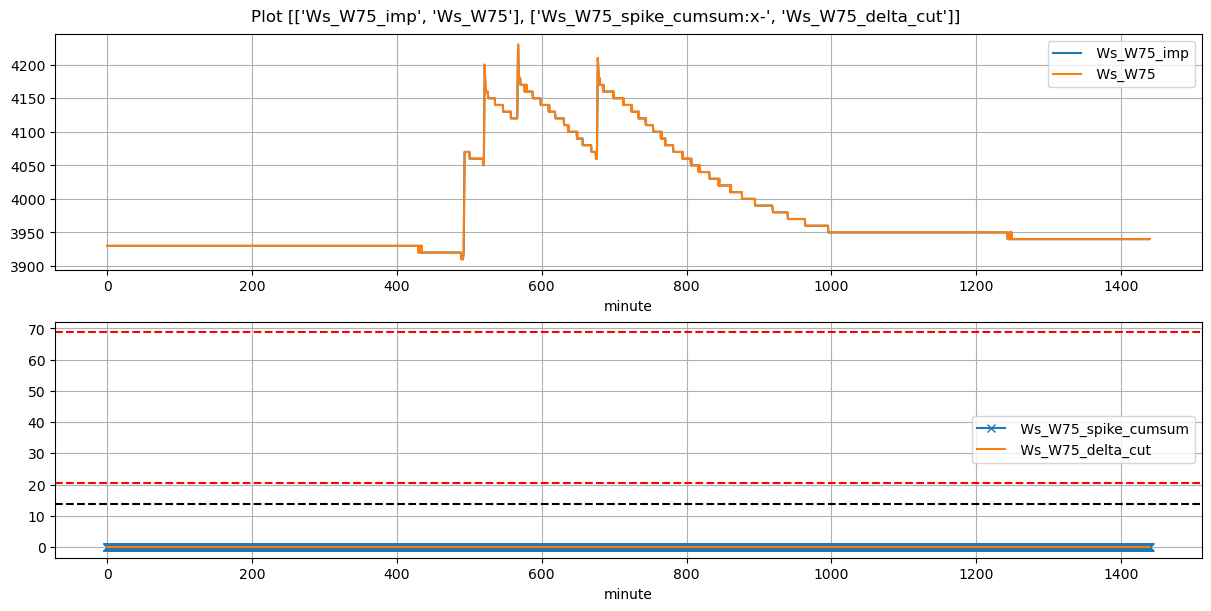
151 |
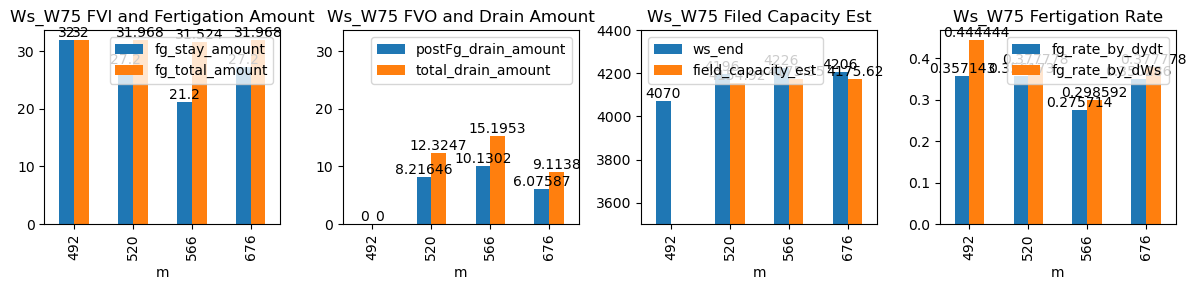
492 |
Ws_W75 |
1.709498 |
26.666667 |
492.10 |
491.833333 |
493.30 |
493.333333 |
3910.000000 |
4070.0 |
72 |
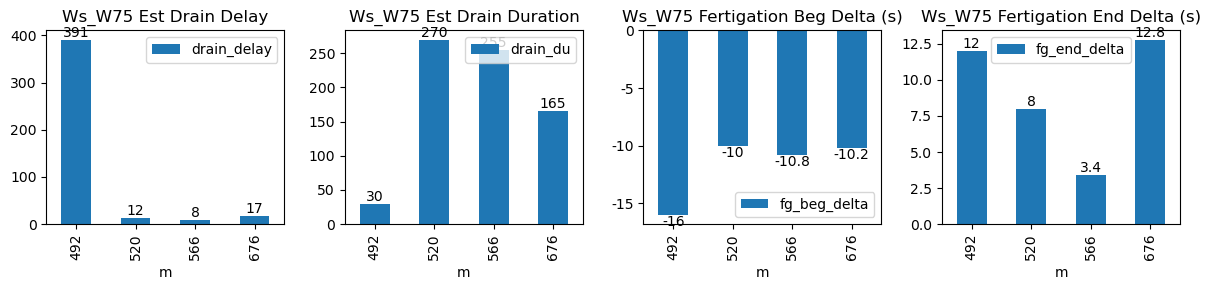
-0.099812 |
-0.097222 |
0.000000 |
0.361429 |
0.444444 |
32.000000 |
True |
-16.0 |
2.0 |
32.000 |
0.000000 |
0.000000 |
0.000000 |
15 |
421 |
-1.924994 |
NaN |
| 2026-03-06 08:40:00+08:00 |
151 |
520 |
Ws_W75 |
1.709498 |
30.000000 |
520.00 |
519.833333 |
521.20 |
521.250000 |
4060.000000 |
4200.0 |
72 |
-0.012359 |
-0.249306 |
-0.008333 |
0.358878 |
0.388889 |
28.000000 |
True |
-10.0 |
3.0 |
31.968 |
4.000000 |
12.407556 |
16.407556 |
94 |
22 |
-3.237683 |
4137.962218 |
| 2026-03-06 09:26:11+08:00 |
151 |
566 |
Ws_W75 |
1.709498 |
30.000000 |
566.18 |
566.000000 |
567.36 |
567.333333 |
4120.000000 |
4230.0 |
71 |
-0.040960 |
-0.218056 |
-0.133333 |
0.277143 |
0.309859 |
22.000000 |
True |
-10.8 |
-1.6 |
31.524 |
4.433093 |
8.866186 |
13.299280 |
85 |
18 |
-4.628115 |
4185.669068 |
| 2026-03-06 11:16:10+08:00 |
151 |
676 |
Ws_W75 |
1.709498 |
30.000000 |
676.17 |
676.000000 |
677.37 |
677.416667 |
4064.777778 |
4210.0 |
72 |
-0.115819 |
-0.240278 |
-0.001389 |
0.353714 |
0.403395 |
29.044444 |
True |
-10.2 |
2.8 |
31.968 |
2.900000 |
6.643672 |
9.543672 |
64 |
27 |
-2.135775 |
4176.781638 |