| 2026-03-05 08:12:07+08:00 |
150 |
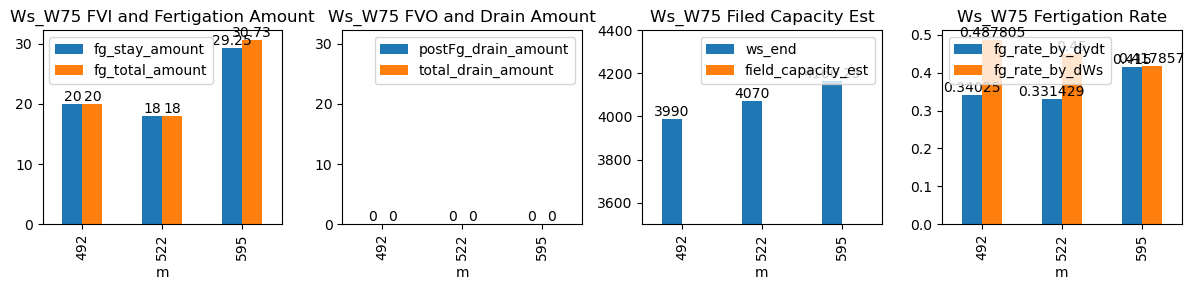
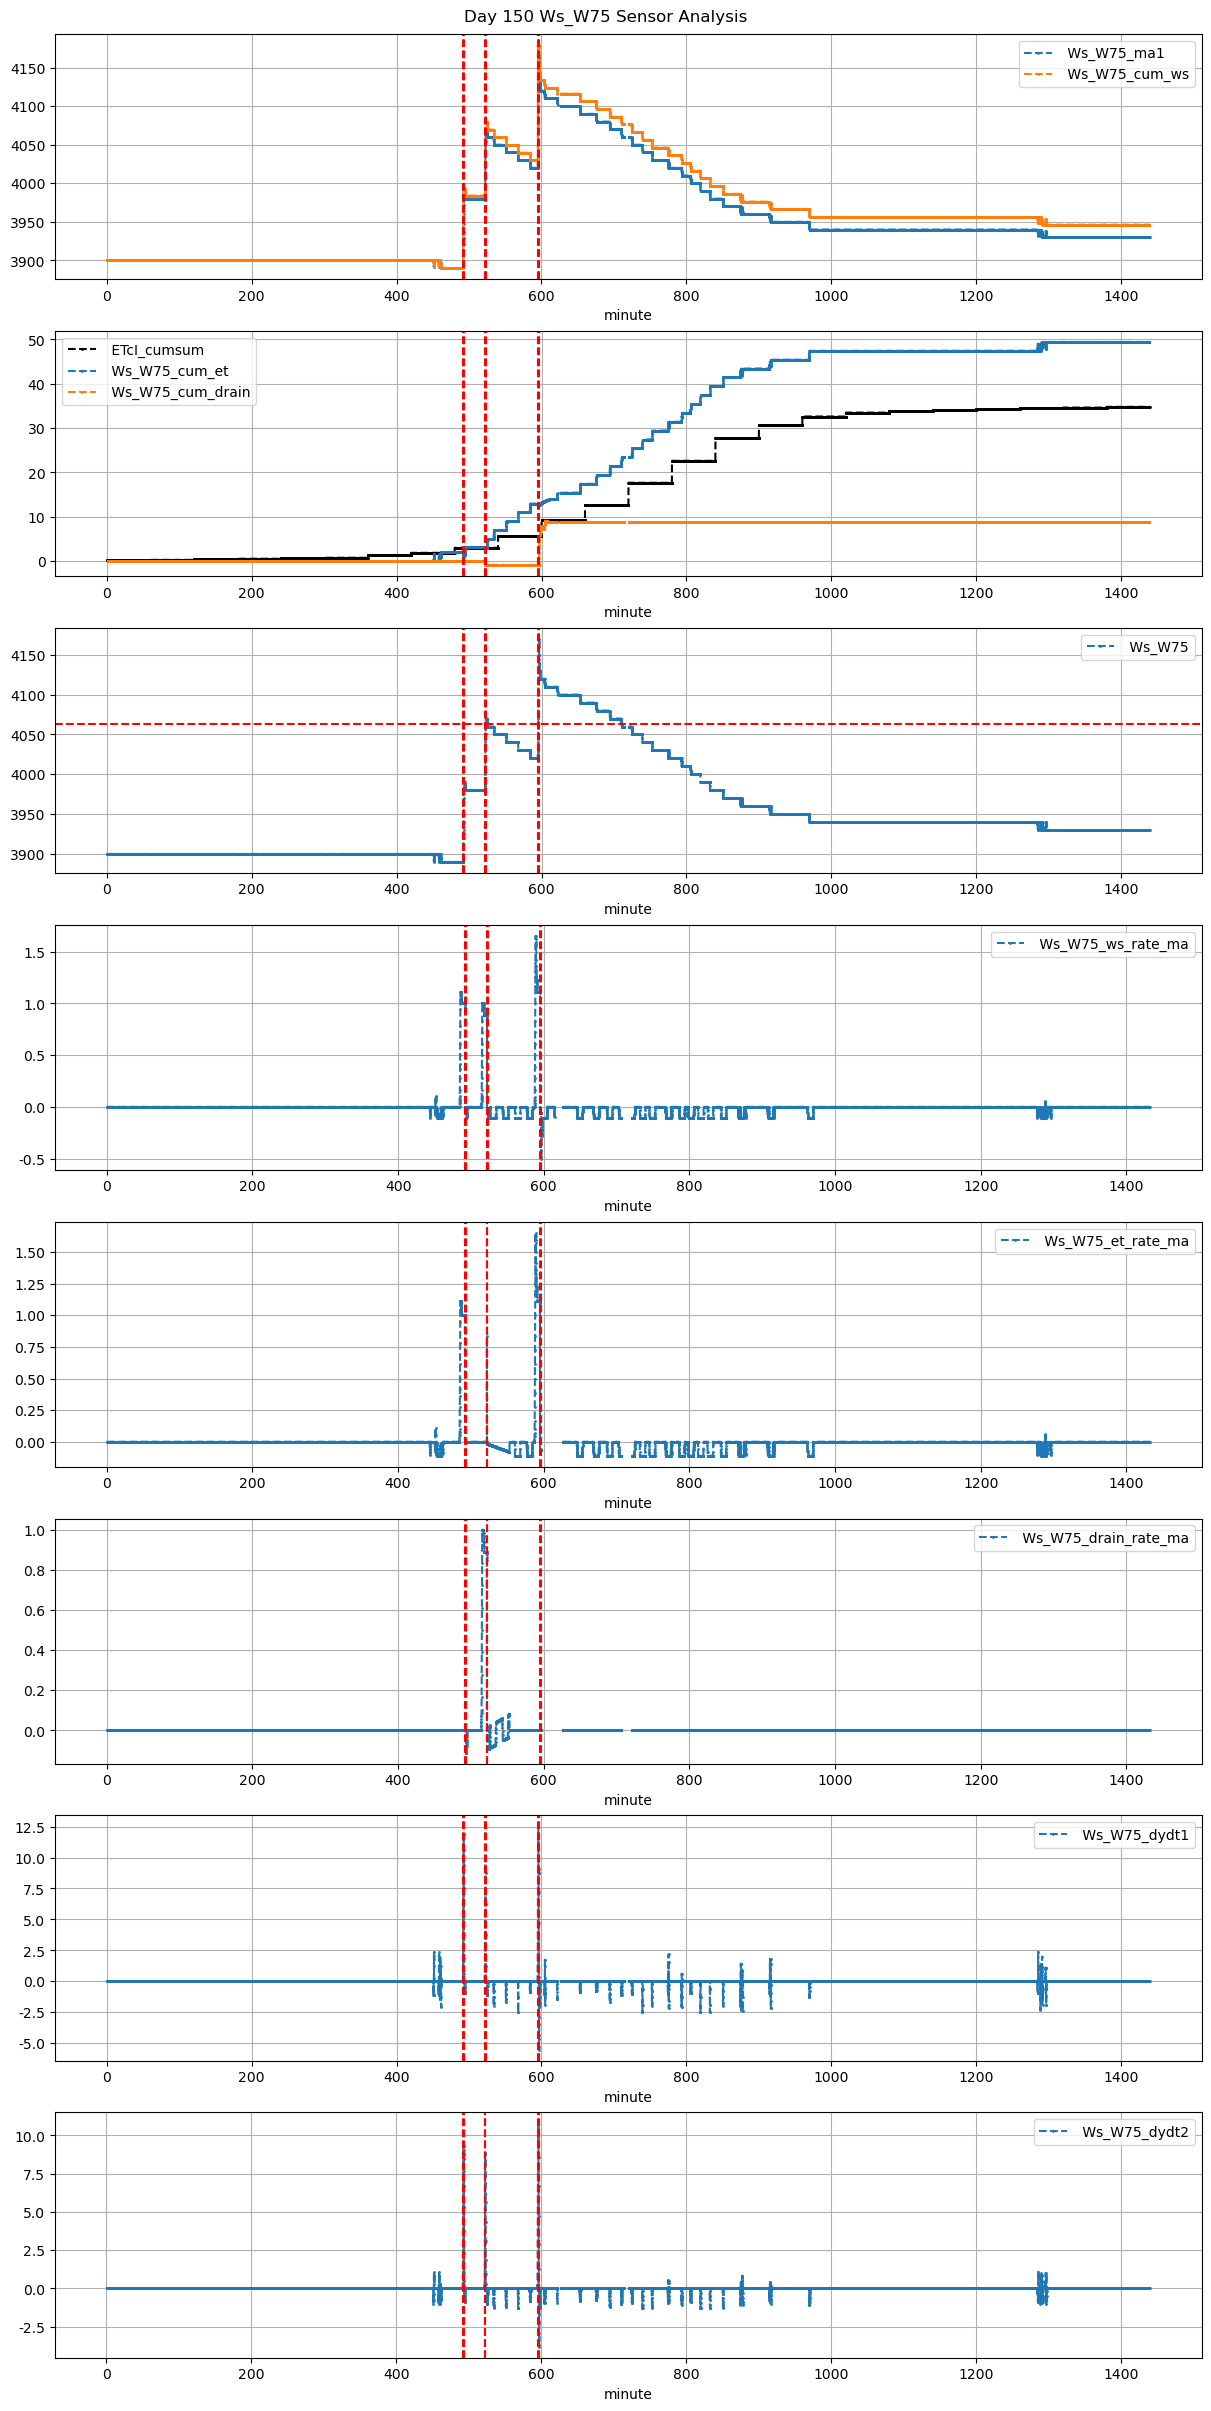
492 |
Ws_W75 |
2.337871 |
29.0 |
492.12 |
492.000000 |
492.80 |
493.000000 |
3890.0 |
3990.0 |
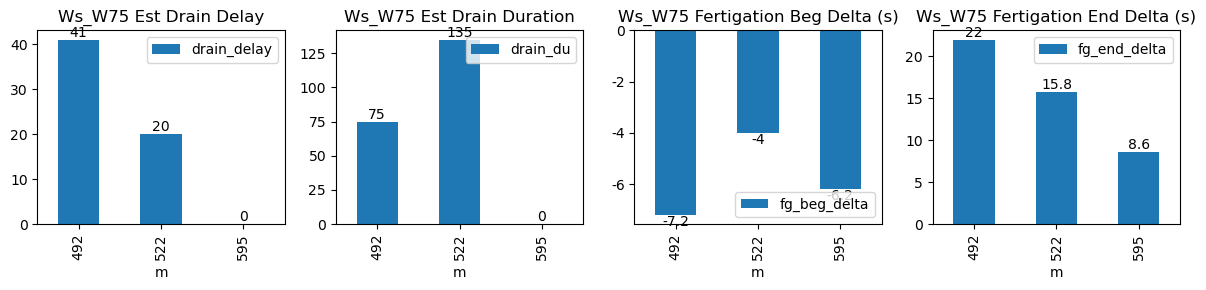
41 |
0.0 |
-0.042361 |
0.000000 |
0.345750 |
0.487805 |
20.0 |
True |
-7.2 |
12.0 |
20.00 |
0.0 |
0 |
0.0 |
25 |
101 |
-0.909091 |
NaN |
| 2026-03-05 08:42:09+08:00 |
150 |
522 |
Ws_W75 |
2.337871 |
30.0 |
522.15 |
522.083333 |
522.82 |
522.916667 |
3980.0 |
4070.0 |
40 |
0.0 |
-0.075000 |
-0.102778 |
0.335714 |
0.450000 |
18.0 |
True |
-4.0 |
5.8 |
18.00 |
0.0 |
0 |
0.0 |
30 |
670 |
-1.711609 |
NaN |
| 2026-03-05 09:55:01+08:00 |
150 |
595 |
Ws_W75 |
2.337871 |
30.0 |
595.02 |
594.916667 |
596.19 |
596.166667 |
4020.0 |
4170.0 |
70 |
0.0 |
-0.184722 |
-0.009722 |
0.418750 |
0.428571 |
30.0 |
True |
-6.2 |
-1.4 |
30.73 |
0.0 |
0 |
0.0 |
54 |
23 |
-4.812500 |
NaN |