| 2026-03-04 08:13:28+08:00 |
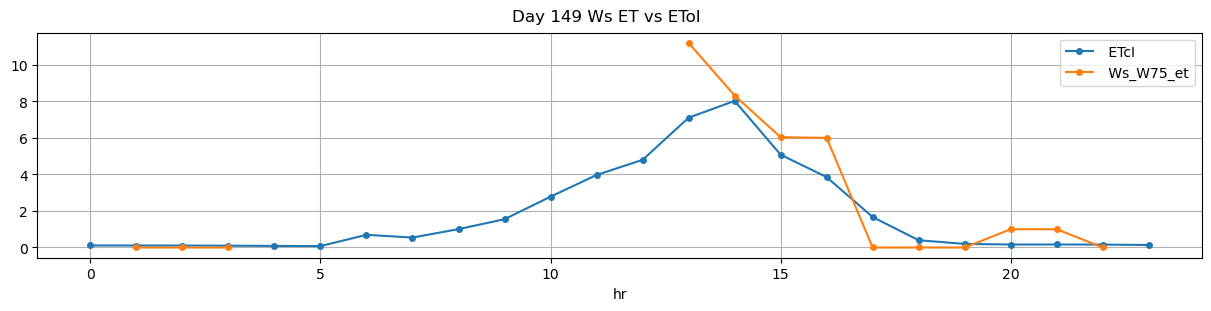
149 |
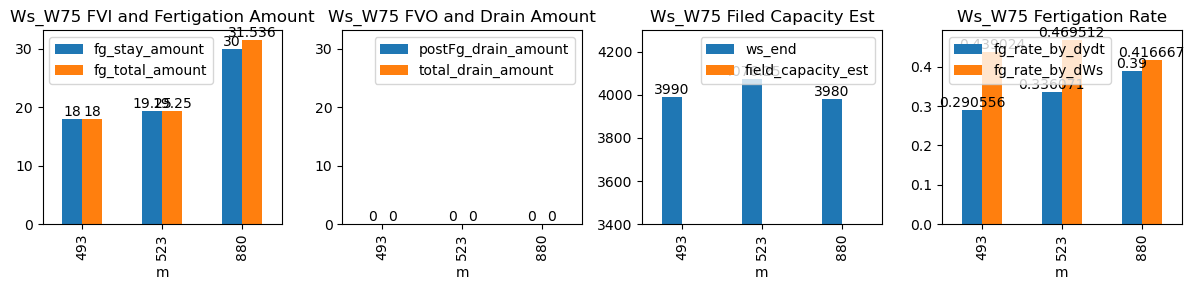
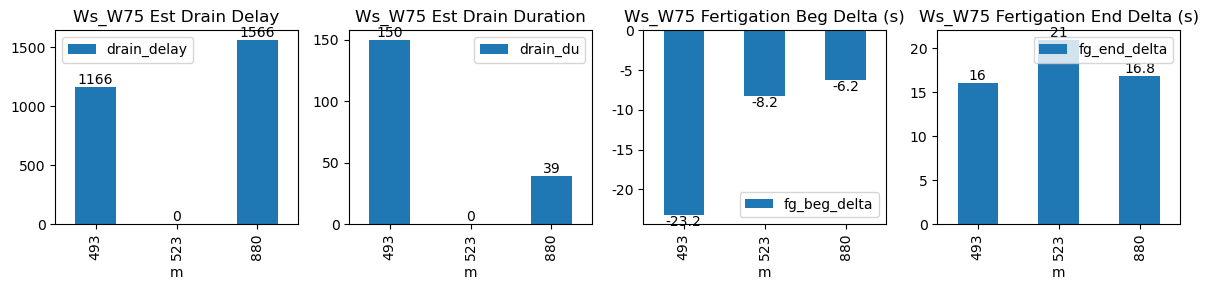
493 |
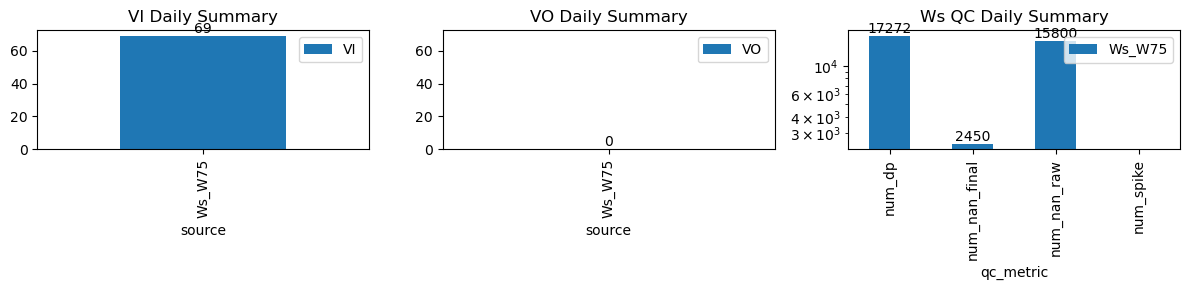
Ws_W75 |
1.761916 |
28.583333 |
493.47 |
493.083333 |
494.15 |
494.416667 |
3900.0 |
3990.00 |
41 |
0.000000 |
0.000000 |
0.000000 |
0.290556 |
0.439024 |
18.00 |
True |
-23.2 |
16.0 |
18.000 |
0.0 |
0 |
0.0 |
150.0 |
1166.0 |
-0.111111 |
NaN |
| 2026-03-04 08:43:28+08:00 |
149 |
523 |
Ws_W75 |
1.761916 |
30.000000 |
523.47 |
523.333333 |
524.15 |
524.500000 |
3980.0 |
4076.25 |
41 |
-0.010758 |
-0.113662 |
-0.070988 |
0.336071 |
0.469512 |
19.25 |
True |
-8.2 |
21.0 |
19.250 |
0.0 |
0 |
0.0 |
NaN |
NaN |
NaN |
NaN |
| 2026-03-04 14:40:01+08:00 |
149 |
880 |
Ws_W75 |
1.761916 |
30.000000 |
880.02 |
879.916667 |
881.22 |
881.500000 |
3830.0 |
3980.00 |
72 |
-0.104994 |
-0.079630 |
-0.061111 |
0.390000 |
0.416667 |
30.00 |
True |
-6.2 |
16.8 |
31.536 |
0.0 |
0 |
0.0 |
39.0 |
1566.0 |
-0.047423 |
NaN |