VI and VO Daily Summary
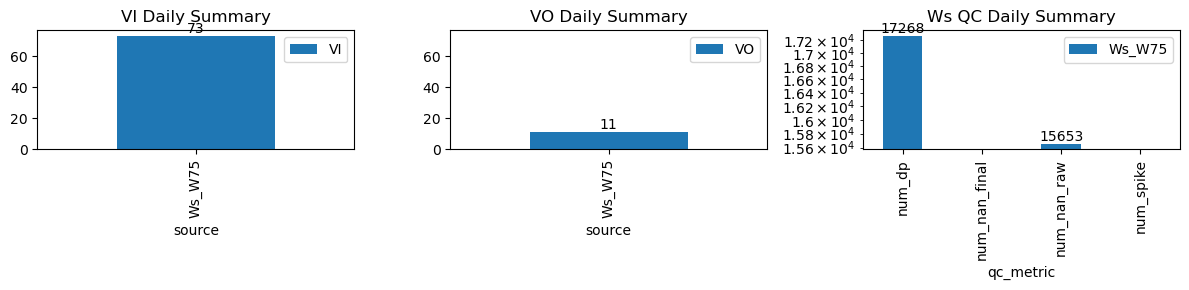
| ws_name | num_dp | num_nan_raw | num_nan_final | num_spike | cum_step_adj |
|---|---|---|---|---|---|
| Ws_W75 | 17,268 | 15,653 | 0 | 0 | 0.00 |
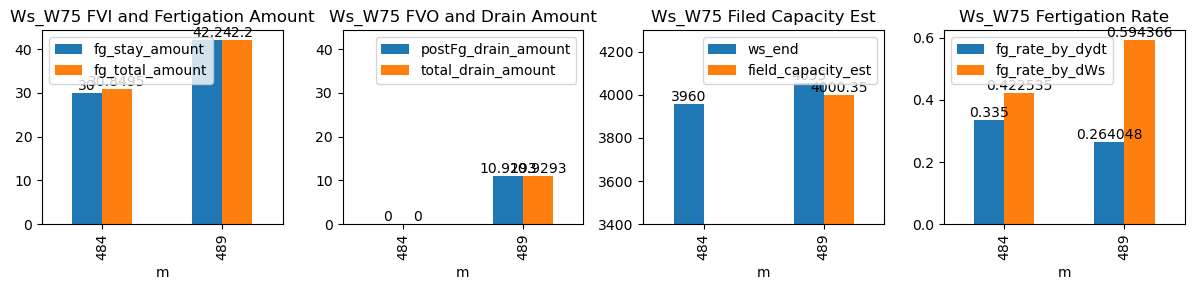
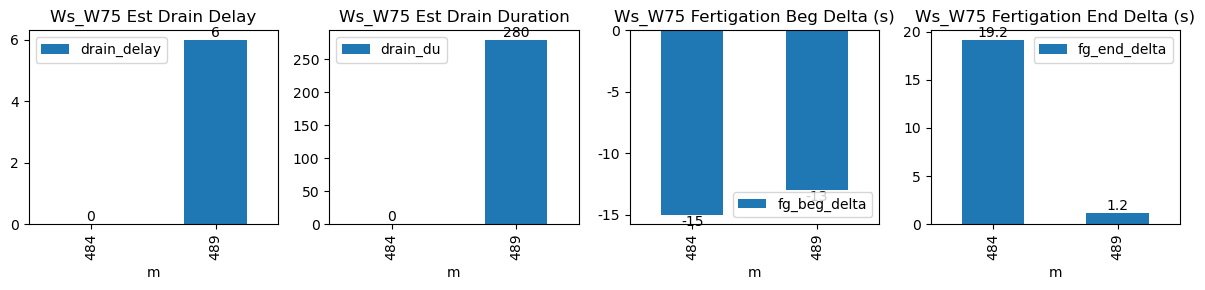
| ds | d | m | ws_name | prominence_cut | max_drain_du | fg_beg | fg_beg_est | fg_end | fg_end_est | ws_beg | ws_end | duc | pre_fg_et | post_fg_ws | post_drn_et | fg_rate_by_dydt | fg_rate_by_dWs | fg_stay_amount | enough_data | fg_beg_delta | fg_end_delta | fg_total_amount | fg_drain_amount | postFg_drain_amount | total_drain_amount | drain_du | drain_delay | drain_rate | field_capacity_est |
|---|---|---|---|---|---|---|---|---|---|---|---|---|---|---|---|---|---|---|---|---|---|---|---|---|---|---|---|---|---|
| 2026-03-03 08:04:45+08:00 | 148 | 484 | Ws_W75 | 1.7616 | 2.916667 | 484.75 | 484.500000 | 485.93 | 486.083333 | 3810.0 | 3960.0 | 71 | 0.0 | 0.000000 | 0.0 | 0.340714 | 0.422535 | 30.0 | True | -15.0 | 9.2 | 30.8495 | 0.0 | 0.000000 | 0.000000 | 19 | 34 | -2.0 | NaN |
| 2026-03-03 08:09:33+08:00 | 148 | 489 | Ws_W75 | 1.7616 | 30.000000 | 489.55 | 489.333333 | 490.73 | 490.833333 | 3886.0 | 4060.0 | 71 | 0.0 | -0.239815 | 0.0 | 0.260952 | 0.490141 | 34.8 | True | -13.0 | 6.2 | 34.8000 | 0.0 | 10.866667 | 10.866667 | 80 | 21 | -4.0 | 4005.666667 |