| 2026-03-20 07:50:01+08:00 |
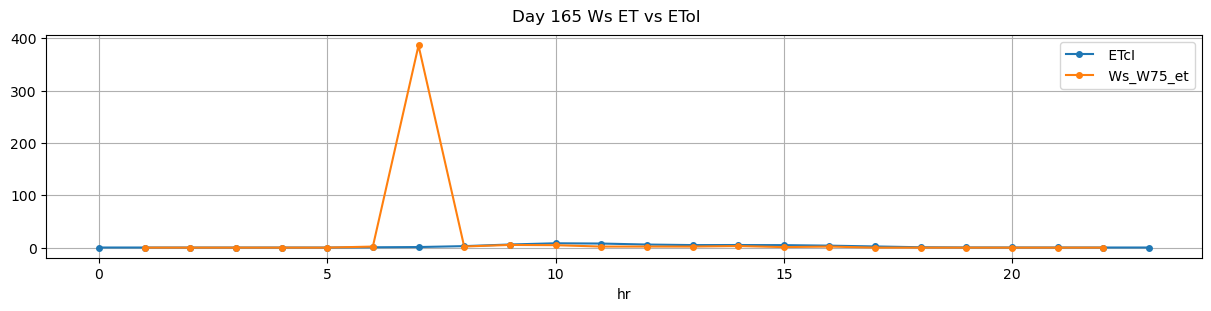
165 |
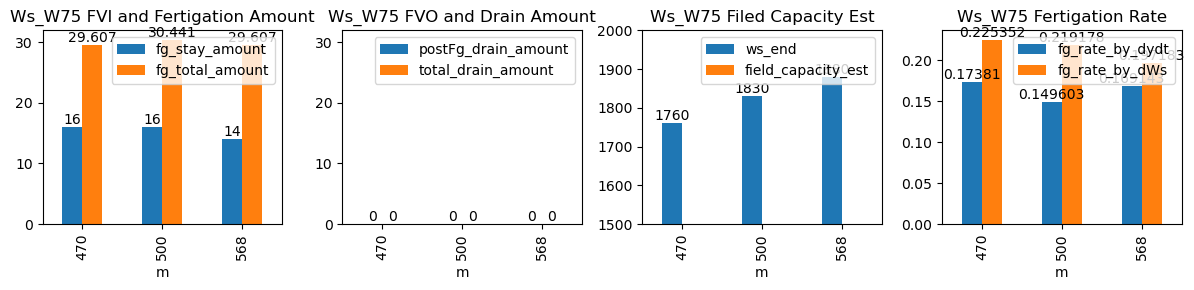
470 |
Ws_W75 |
0.961988 |
28.666667 |
470.02 |
469.666667 |
471.20 |
471.333333 |
3522.272727 |
3602.272727 |
71 |
-8.474576e-02 |
-0.125926 |
0.000000 |
0.173810 |
0.225352 |
16.0 |
True |
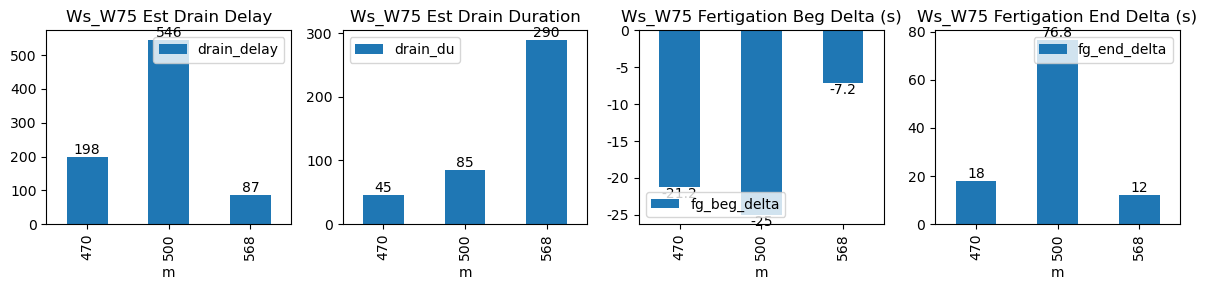
-21.2 |
8.0 |
29.607 |
0.0 |
0 |
0.0 |
30 |
238 |
-1.037702 |
NaN |
| 2026-03-20 08:20:00+08:00 |
165 |
500 |
Ws_W75 |
0.961988 |
30.000000 |
500.00 |
499.583333 |
501.22 |
501.333333 |
3592.272727 |
3672.272727 |
73 |
-3.853791e-15 |
0.000000 |
0.000000 |
0.169127 |
0.219178 |
16.0 |
True |
-25.0 |
6.8 |
30.441 |
0.0 |
0 |
0.0 |
15 |
36 |
-1.414286 |
NaN |
| 2026-03-20 09:28:37+08:00 |
165 |
568 |
Ws_W75 |
0.961988 |
30.000000 |
568.62 |
568.500000 |
569.80 |
569.833333 |
3652.272727 |
3722.272727 |
71 |
0.000000e+00 |
-0.088889 |
-0.123843 |
0.171143 |
0.197183 |
14.0 |
True |
-7.2 |
2.0 |
29.607 |
0.0 |
0 |
0.0 |
9 |
362 |
-1.493199 |
NaN |