| 2026-04-01 07:50:00+08:00 |
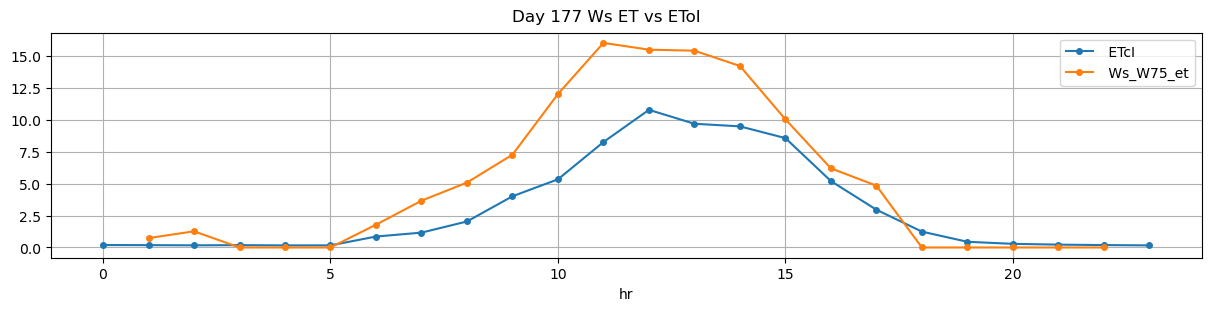
177 |
470 |
Ws_W75 |
1.534102 |
28.666667 |
470.00 |
469.833333 |
471.20 |
471.333333 |
3880.0 |
4040.0 |
72 |
0.000000 |
-0.075694 |
0.000000 |
0.374490 |
0.444444 |
32.0 |
True |
-10.0 |
8.0 |
32.0 |
0.000000 |
0.000000 |
0.000000 |
35 |
22 |
-1.428571 |
NaN |
| 2026-04-01 08:20:00+08:00 |
177 |
500 |
Ws_W75 |
1.534102 |
30.000000 |
500.00 |
499.750000 |
501.17 |
501.000000 |
4020.0 |
4120.0 |
70 |
0.000000 |
-0.231250 |
-0.088889 |
0.264286 |
0.285714 |
20.0 |
True |
-15.0 |
-10.2 |
28.0 |
5.445556 |
10.891111 |
16.336667 |
120 |
4 |
-5.469679 |
4065.544444 |
| 2026-04-01 09:20:00+08:00 |
177 |
560 |
Ws_W75 |
1.534102 |
30.000000 |
560.00 |
559.750000 |
561.20 |
560.916667 |
4020.0 |
4110.0 |
72 |
-0.012712 |
-0.159091 |
-0.080093 |
0.244286 |
0.250000 |
18.0 |
True |
-15.0 |
-17.0 |
28.8 |
5.626151 |
11.252301 |
16.878452 |
75 |
2 |
-4.237101 |
4053.738493 |
| 2026-04-01 12:33:52+08:00 |
177 |
753 |
Ws_W75 |
1.534102 |
30.000000 |
753.87 |
753.583333 |
755.04 |
755.083333 |
3850.0 |
4000.0 |
70 |
-0.079588 |
-0.203819 |
-0.145448 |
0.352857 |
0.428571 |
30.0 |
True |
-17.2 |
2.6 |
30.0 |
0.000000 |
0.000000 |
0.000000 |
24 |
107 |
-1.899058 |
NaN |
| 2026-04-01 16:00:01+08:00 |
177 |
960 |
Ws_W75 |
1.534102 |
30.000000 |
960.02 |
959.750000 |
961.19 |
961.666667 |
3760.0 |
3917.5 |
70 |
-0.122999 |
-0.010937 |
0.000000 |
0.340536 |
0.450000 |
31.5 |
True |
-16.2 |
28.6 |
31.5 |
0.000000 |
0.000000 |
0.000000 |
9 |
1263 |
-0.996661 |
NaN |