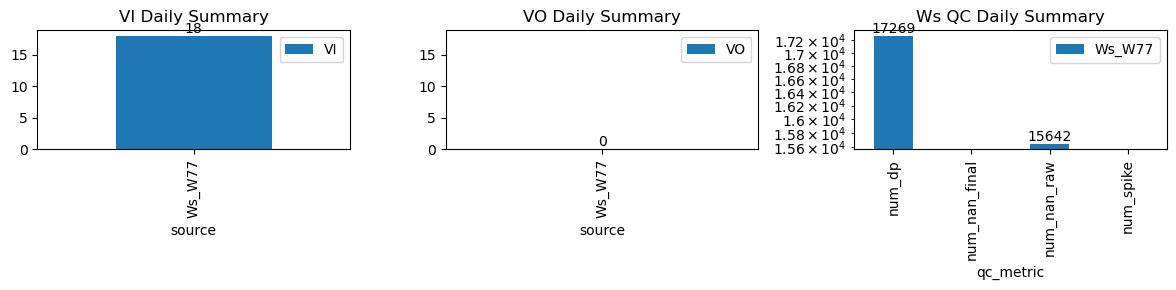
VI and VO Daily Summary
| ws_name | num_dp | num_nan_raw | num_nan_final | num_spike | cum_step_adj |
|---|---|---|---|---|---|
| Ws_W77 | 17,269 | 15,642 | 0 | 0 | 0.00 |
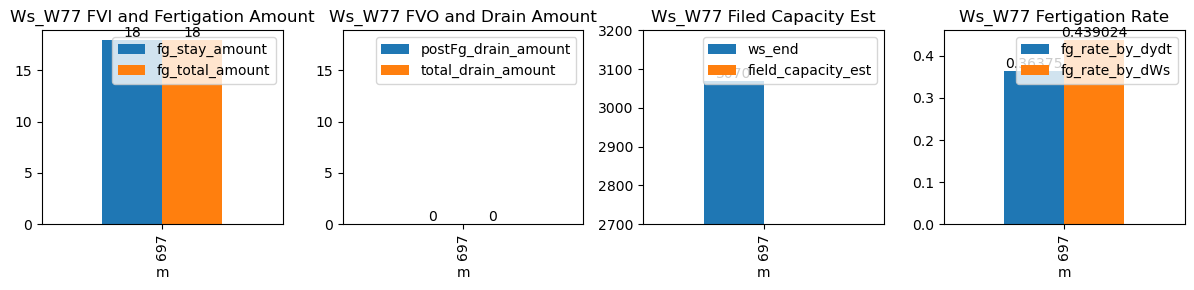
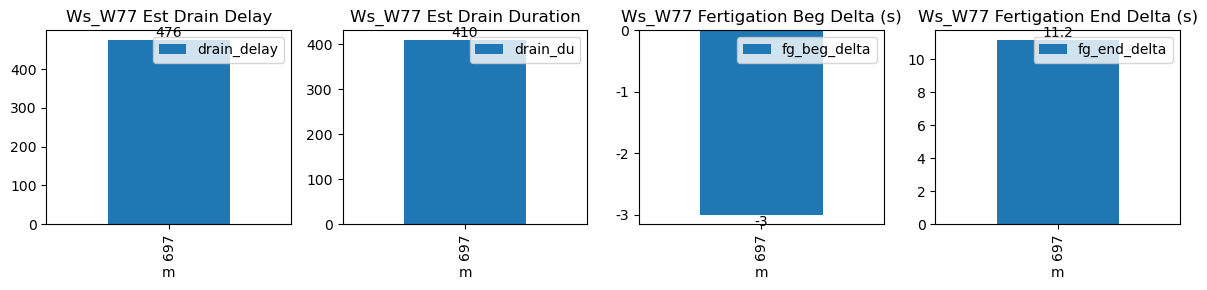
| ds | d | m | ws_name | prominence_cut | max_drain_du | fg_beg | fg_beg_est | fg_end | fg_end_est | ws_beg | ws_end | duc | pre_fg_et | post_fg_ws | post_drn_et | fg_rate_by_dydt | fg_rate_by_dWs | fg_stay_amount | enough_data | fg_beg_delta | fg_end_delta | fg_total_amount | fg_drain_amount | postFg_drain_amount | total_drain_amount | drain_du | drain_delay | drain_rate | field_capacity_est |
|---|---|---|---|---|---|---|---|---|---|---|---|---|---|---|---|---|---|---|---|---|---|---|---|---|---|---|---|---|---|
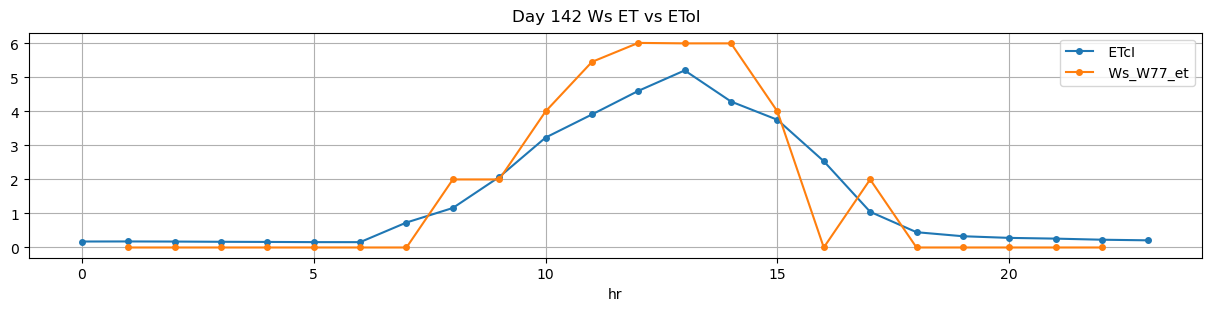
| 2026-02-25 11:37:48+08:00 | 142 | 697 | Ws_W77 | 1.576679 | 30 | 697.8 | 697.75 | 698.48 | 698.666667 | 2980.0 | 3070.0 | 41 | -0.058677 | -0.007407 | -0.033951 | 0.36375 | 0.439024 | 18.0 | True | -3.0 | 11.2 | 18.0 | 0.0 | 0 | 0.0 | 410 | 476 | -0.096354 | NaN |