VI and VO Daily Summary
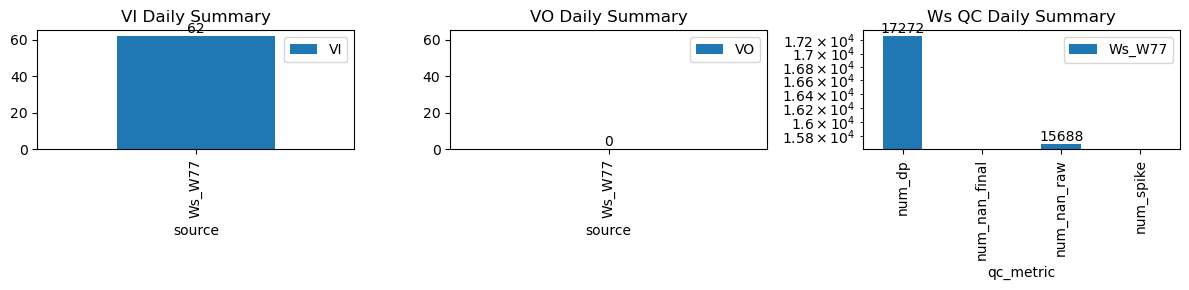
| ws_name | num_dp | num_nan_raw | num_nan_final | num_spike | cum_step_adj |
|---|---|---|---|---|---|
| Ws_W77 | 17,272 | 15,688 | 0 | 0 | 0.00 |
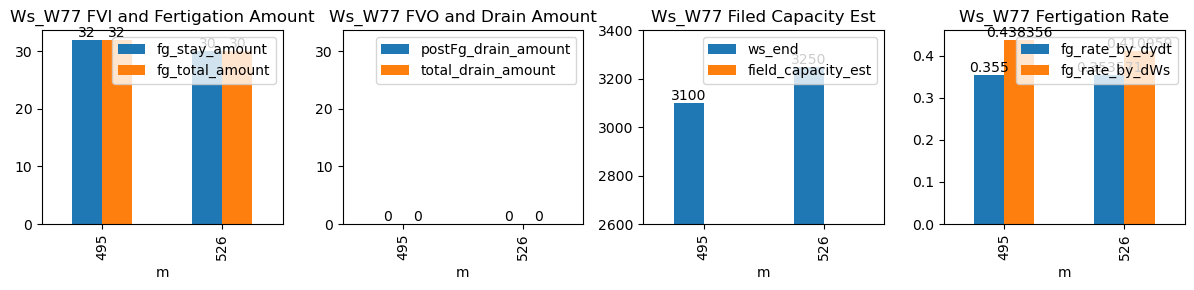
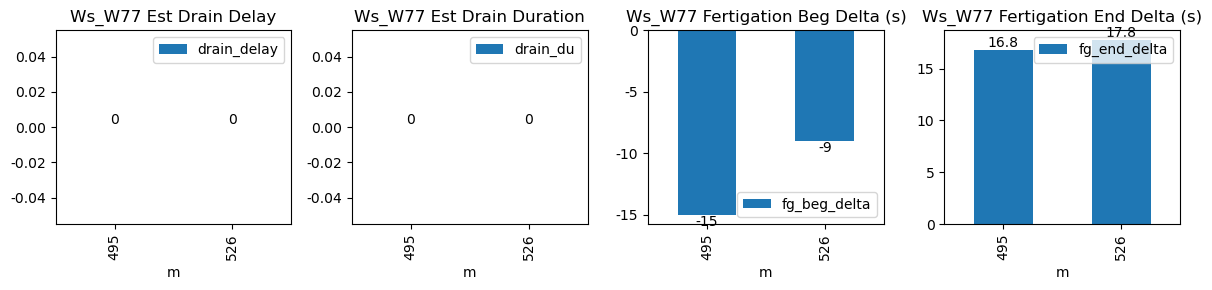
| ds | d | m | ws_name | prominence_cut | max_drain_du | fg_beg | fg_beg_est | fg_end | fg_end_est | ws_beg | ws_end | duc | pre_fg_et | post_fg_ws | post_drn_et | fg_rate_by_dydt | fg_rate_by_dWs | fg_stay_amount | enough_data | fg_beg_delta | fg_end_delta | fg_total_amount | fg_drain_amount | postFg_drain_amount | total_drain_amount | drain_du | drain_delay | drain_rate | field_capacity_est |
|---|---|---|---|---|---|---|---|---|---|---|---|---|---|---|---|---|---|---|---|---|---|---|---|---|---|---|---|---|---|
| 2026-02-26 08:15:00+08:00 | 143 | 495 | Ws_W77 | 0.822164 | 29.5 | 495.0 | 494.75 | 496.22 | 496.500000 | 2940.0 | 3100.0 | 73 | 0.000000 | 0.0 | 0.0 | 0.355000 | 0.438356 | 32.0 | True | -15.0 | 16.8 | 32.0 | 0.0 | 0 | 0.0 | NaN | NaN | NaN | NaN |
| 2026-02-26 08:46:54+08:00 | 143 | 526 | Ws_W77 | 0.822164 | 30.0 | 526.9 | 526.75 | 528.12 | 528.416667 | 3100.0 | 3250.0 | 73 | -0.007446 | 0.0 | 0.0 | 0.353571 | 0.410959 | 30.0 | True | -9.0 | 17.8 | 30.0 | 0.0 | 0 | 0.0 | NaN | NaN | NaN | NaN |