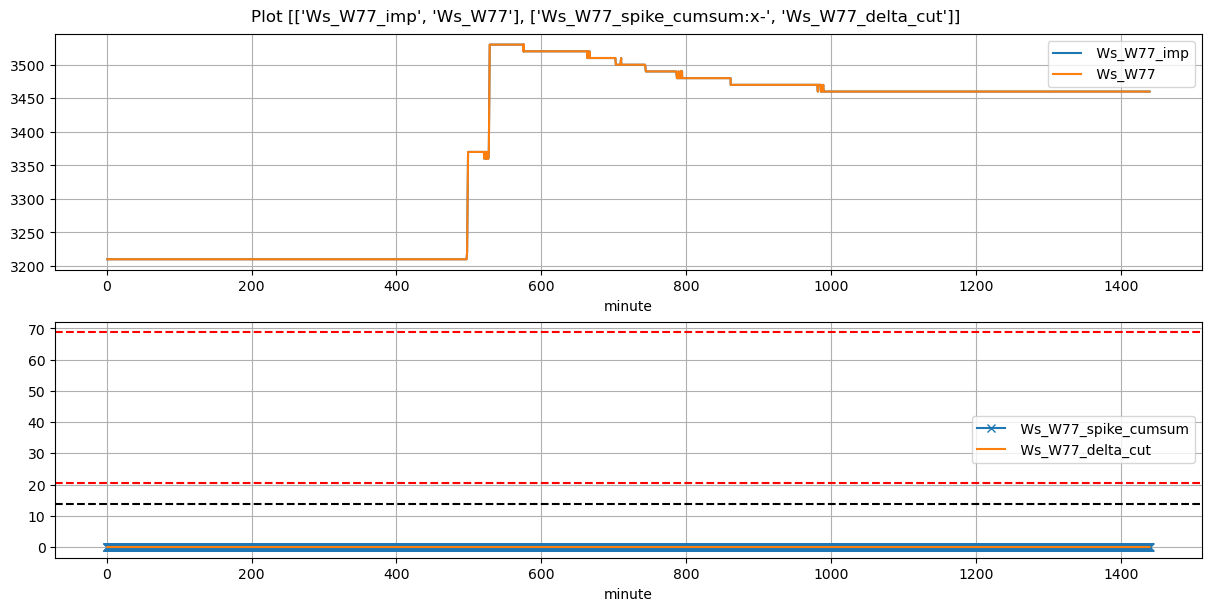
VI and VO Daily Summary
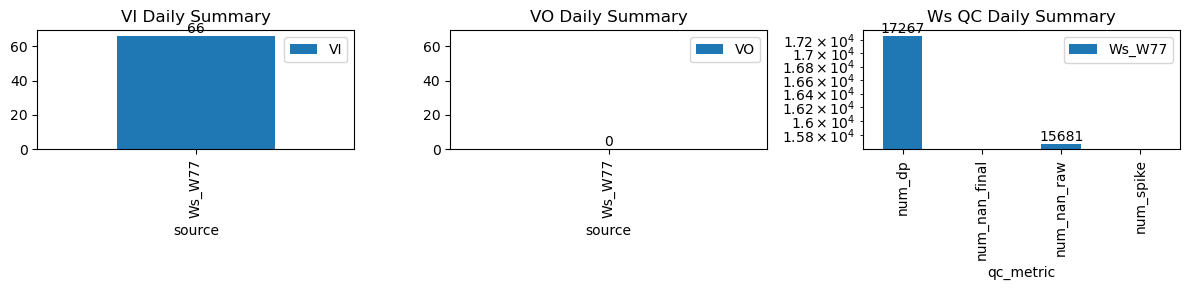
| ws_name | num_dp | num_nan_raw | num_nan_final | num_spike | cum_step_adj |
|---|---|---|---|---|---|
| Ws_W77 | 17,267 | 15,681 | 0 | 0 | 0.00 |
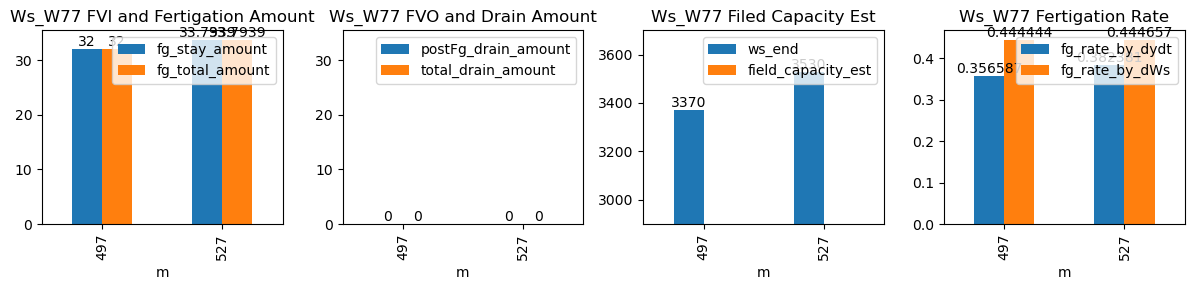
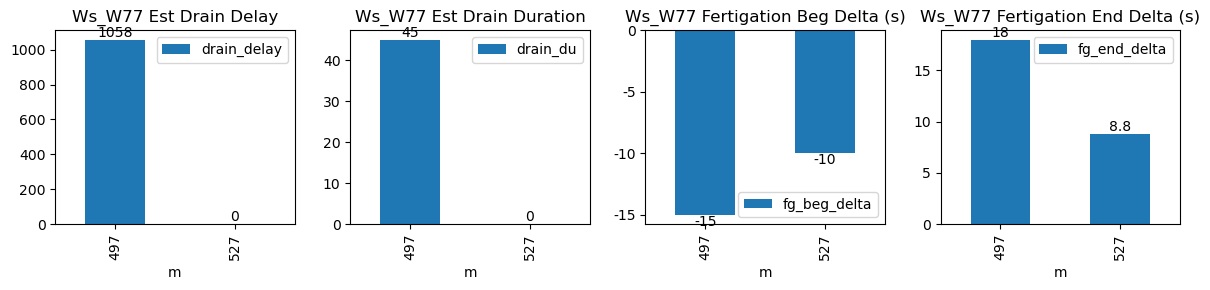
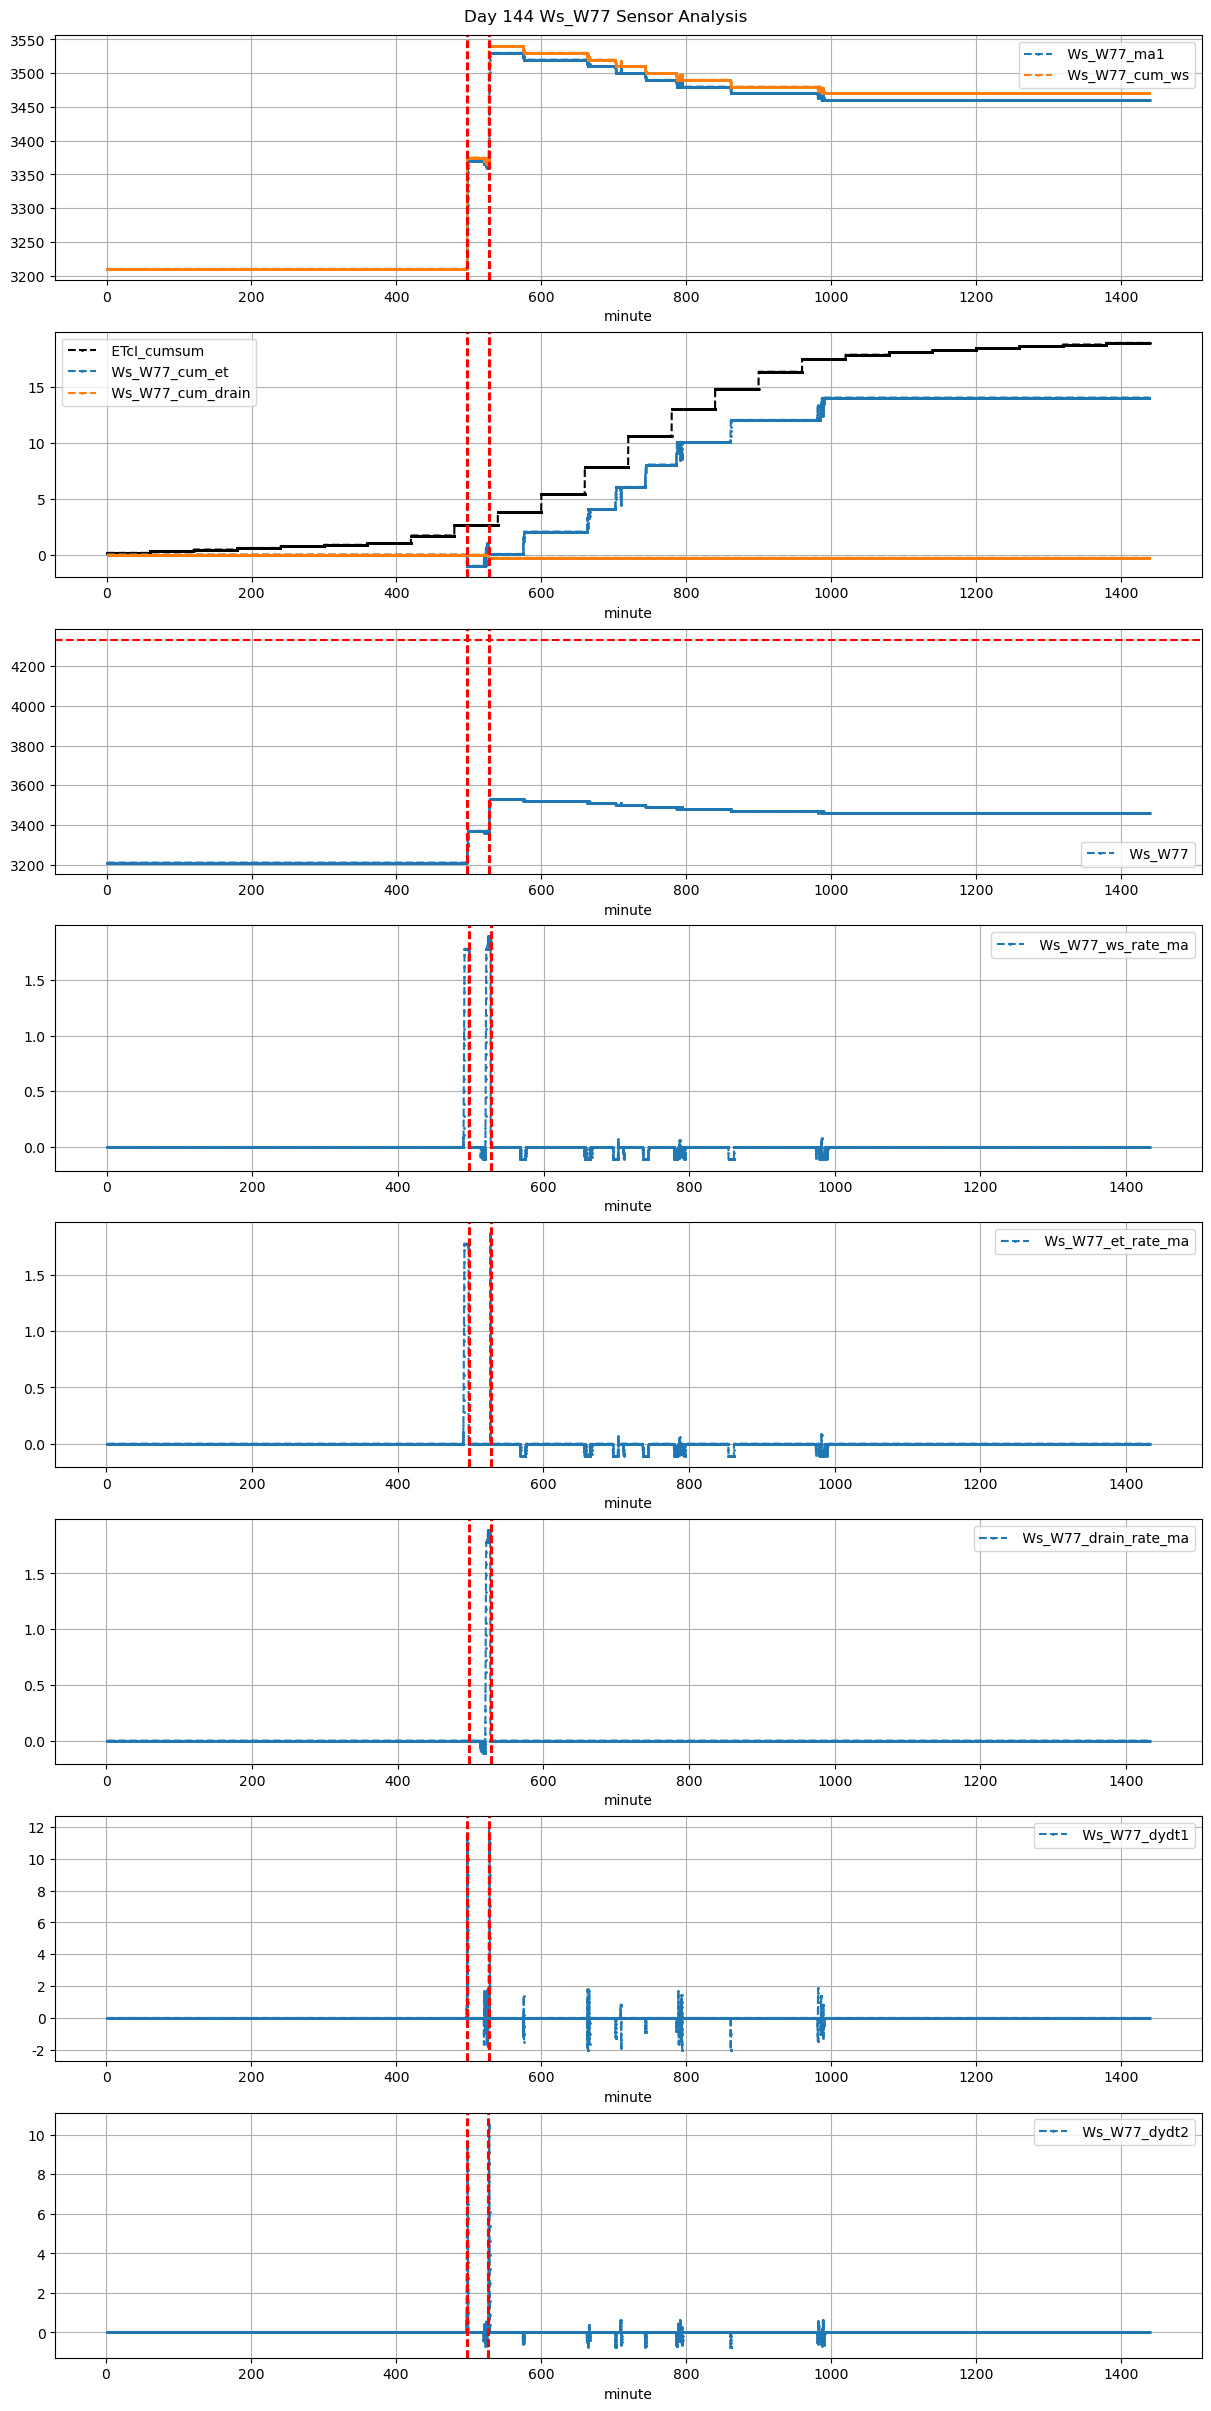
| ds | d | m | ws_name | prominence_cut | max_drain_du | fg_beg | fg_beg_est | fg_end | fg_end_est | ws_beg | ws_end | duc | pre_fg_et | post_fg_ws | post_drn_et | fg_rate_by_dydt | fg_rate_by_dWs | fg_stay_amount | enough_data | fg_beg_delta | fg_end_delta | fg_total_amount | fg_drain_amount | postFg_drain_amount | total_drain_amount | drain_du | drain_delay | drain_rate | field_capacity_est |
|---|---|---|---|---|---|---|---|---|---|---|---|---|---|---|---|---|---|---|---|---|---|---|---|---|---|---|---|---|---|
| 2026-02-27 08:17:30+08:00 | 144 | 497 | Ws_W77 | 1.034427 | 28.166667 | 497.5 | 497.250000 | 498.70 | 498.833333 | 3210.0 | 3370.0 | 72 | 0.000000 | 0.0 | 0.0 | 0.360238 | 0.444444 | 32.0 | True | -15.0 | 8.0 | 32.0 | 0.0 | 0 | 0.0 | 20.0 | 1662.0 | -1.691667 | NaN |
| 2026-02-27 08:47:30+08:00 | 144 | 527 | Ws_W77 | 1.034427 | 30.000000 | 527.5 | 527.333333 | 528.77 | 528.750000 | 3360.0 | 3530.0 | 76 | -0.080508 | 0.0 | 0.0 | 0.390000 | 0.447368 | 34.0 | True | -10.0 | -1.2 | 34.0 | 0.0 | 0 | 0.0 | NaN | NaN | NaN | NaN |