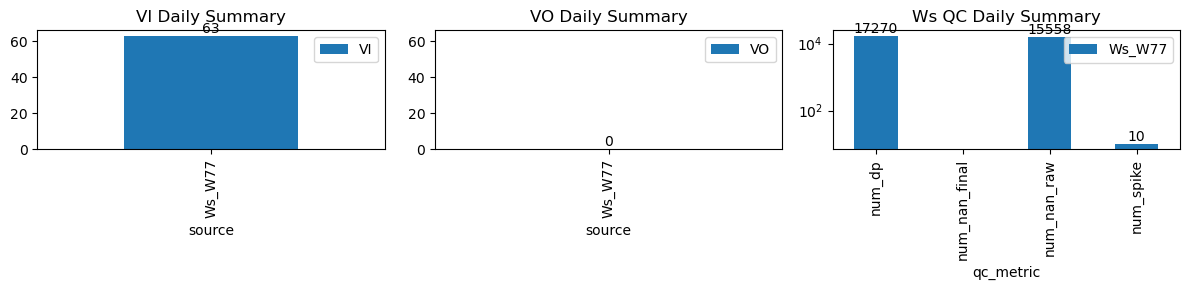
VI and VO Daily Summary
| ws_name | num_dp | num_nan_raw | num_nan_final | num_spike | cum_step_adj |
|---|---|---|---|---|---|
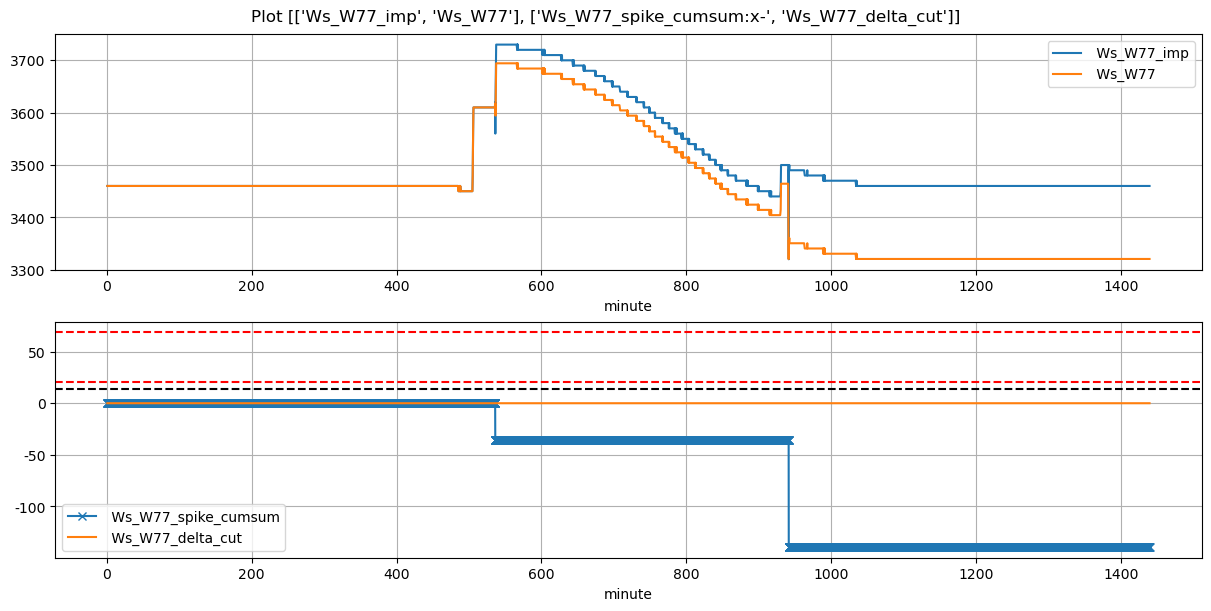
| Ws_W77 | 17,270 | 15,558 | 0 | 10 | -139.43 |
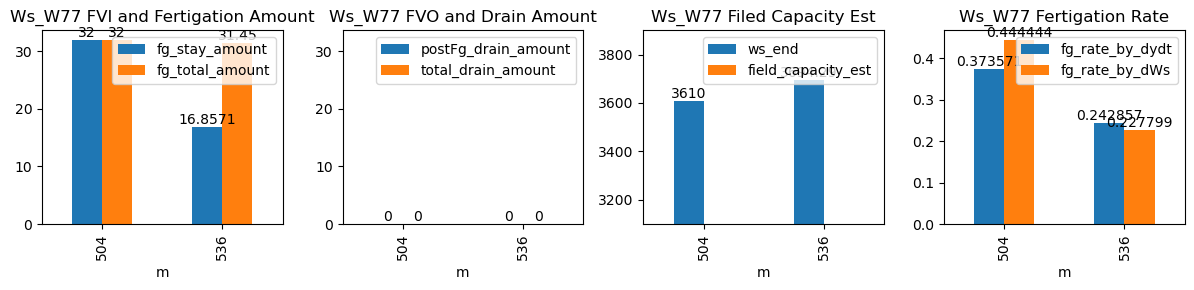
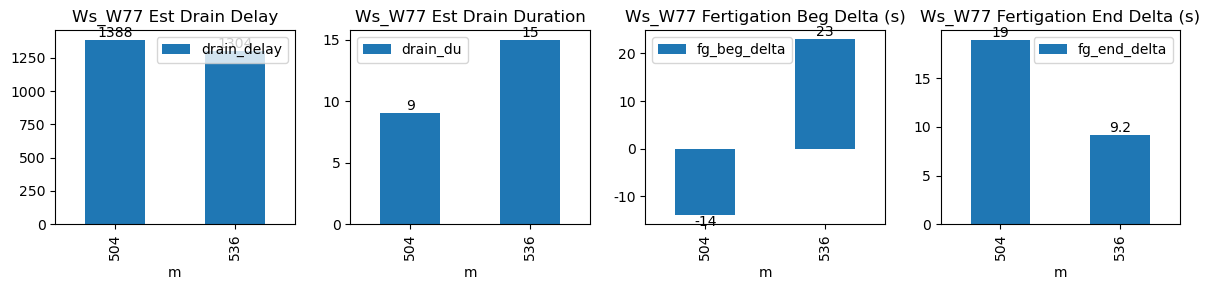
| ds | d | m | ws_name | prominence_cut | max_drain_du | fg_beg | fg_beg_est | fg_end | fg_end_est | ws_beg | ws_end | duc | pre_fg_et | post_fg_ws | post_drn_et | fg_rate_by_dydt | fg_rate_by_dWs | fg_stay_amount | enough_data | fg_beg_delta | fg_end_delta | fg_total_amount | fg_drain_amount | postFg_drain_amount | total_drain_amount | drain_du | drain_delay | drain_rate | field_capacity_est |
|---|---|---|---|---|---|---|---|---|---|---|---|---|---|---|---|---|---|---|---|---|---|---|---|---|---|---|---|---|---|
| 2026-02-28 08:24:54+08:00 | 145 | 504 | Ws_W77 | 1.234129 | 29.583333 | 504.9 | 504.666667 | 506.10 | 506.416667 | 3450.0 | 3610.000000 | 72 | 0.000000 | 0.0 | 0.000000 | 0.373571 | 0.444444 | 32.000000 | True | -14.0 | 19.0 | 32.00 | 0.0 | 0 | 0.0 | 9 | 1388 | -0.102381 | NaN |
| 2026-02-28 08:56:12+08:00 | 145 | 536 | Ws_W77 | 1.234129 | 30.000000 | 536.2 | 536.583333 | 537.43 | 537.583333 | 3610.0 | 3694.285714 | 74 | -0.012693 | 0.0 | -0.096914 | 0.242857 | 0.227799 | 16.857143 | True | 23.0 | 9.2 | 31.45 | 0.0 | 0 | 0.0 | 15 | 1304 | -0.037711 | NaN |