| 2026-03-02 07:49:55+08:00 |
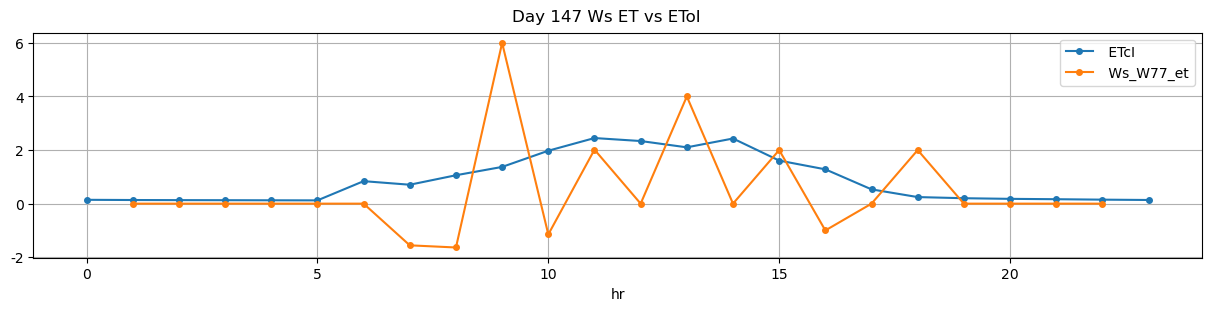
147 |
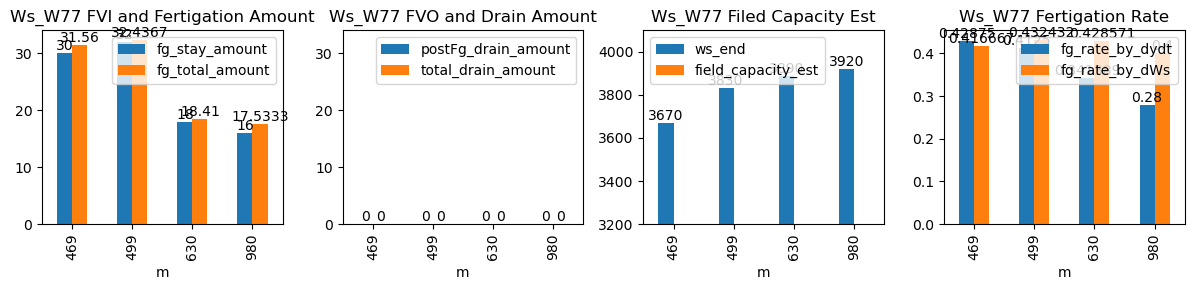
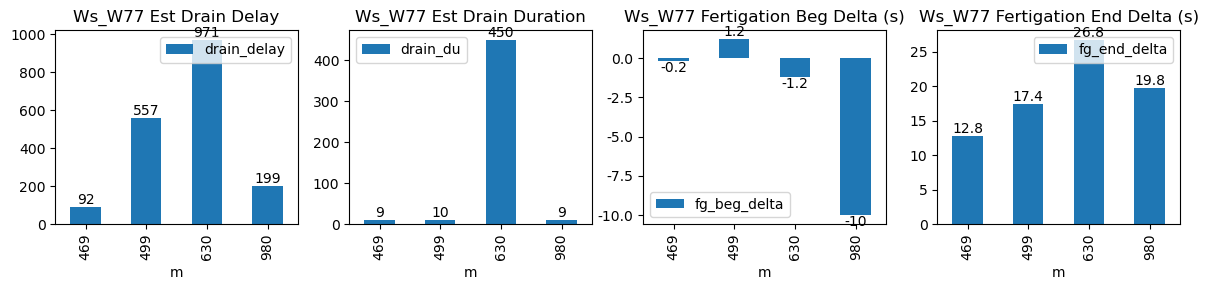
469 |
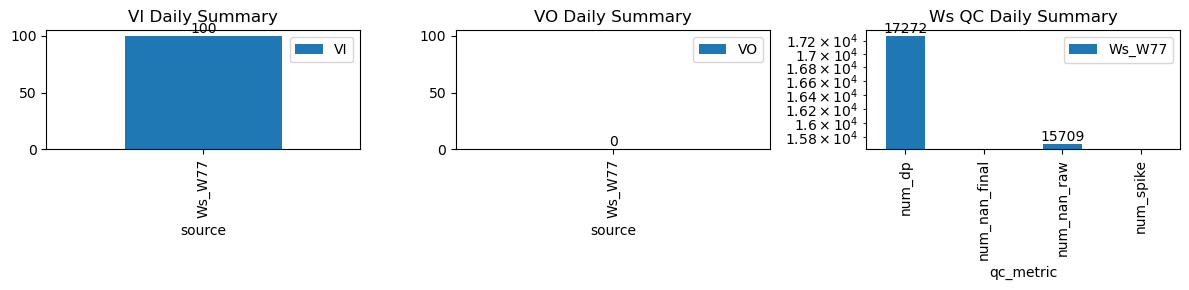
Ws_W77 |
1.793335 |
27.666667 |
469.92 |
469.916667 |
471.12 |
471.333333 |
3520.0 |
3670.0 |
72 |
0.000000 |
0.0 |
0.000000 |
0.428750 |
0.416667 |
30.0 |
True |
-0.2 |
12.8 |
31.560000 |
0.0 |
0.0 |
0.0 |
9 |
92 |
-2.273737e-13 |
NaN |
| 2026-03-02 08:19:59+08:00 |
147 |
499 |
Ws_W77 |
1.793335 |
30.000000 |
499.98 |
500.000000 |
501.21 |
501.500000 |
3670.0 |
3830.0 |
74 |
-0.007364 |
0.0 |
0.000000 |
0.412500 |
0.432432 |
32.0 |
True |
1.2 |
17.4 |
32.436667 |
0.0 |
0.0 |
0.0 |
10 |
557 |
-2.273737e-13 |
NaN |
| 2026-03-02 10:30:01+08:00 |
147 |
630 |
Ws_W77 |
1.793335 |
30.000000 |
630.02 |
630.000000 |
630.72 |
631.166667 |
3800.0 |
3890.0 |
42 |
0.000000 |
0.0 |
-0.005556 |
0.341389 |
0.428571 |
18.0 |
True |
-1.2 |
26.8 |
18.410000 |
0.0 |
0.0 |
0.0 |
450 |
971 |
-1.081089e-01 |
NaN |
| 2026-03-02 16:20:00+08:00 |
147 |
980 |
Ws_W77 |
1.793335 |
30.000000 |
980.00 |
979.833333 |
980.67 |
981.000000 |
3840.0 |
3920.0 |
40 |
0.000000 |
0.0 |
0.000000 |
0.280000 |
0.400000 |
16.0 |
True |
-10.0 |
19.8 |
17.533333 |
0.0 |
0.0 |
0.0 |
9 |
199 |
-2.273737e-13 |
NaN |