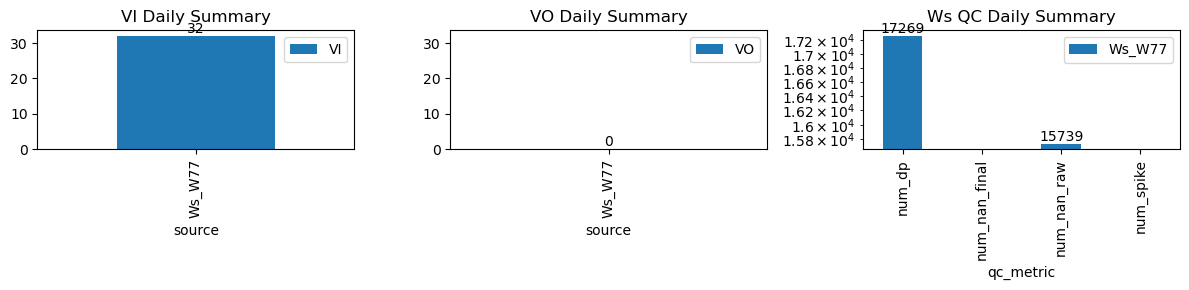
VI and VO Daily Summary
| ws_name | num_dp | num_nan_raw | num_nan_final | num_spike | cum_step_adj |
|---|---|---|---|---|---|
| Ws_W77 | 17,269 | 15,739 | 0 | 0 | 0.00 |
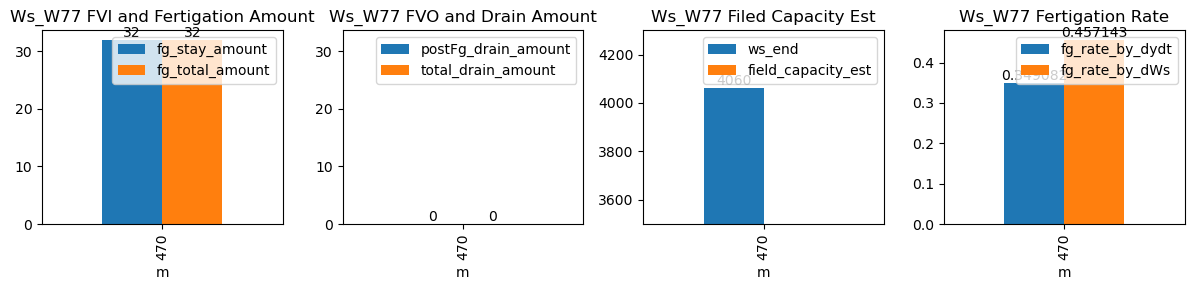
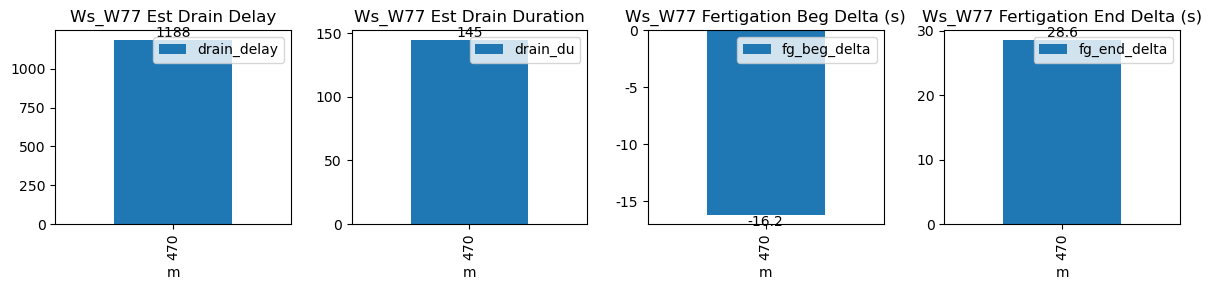
| ds | d | m | ws_name | prominence_cut | max_drain_du | fg_beg | fg_beg_est | fg_end | fg_end_est | ws_beg | ws_end | duc | pre_fg_et | post_fg_ws | post_drn_et | fg_rate_by_dydt | fg_rate_by_dWs | fg_stay_amount | enough_data | fg_beg_delta | fg_end_delta | fg_total_amount | fg_drain_amount | postFg_drain_amount | total_drain_amount | drain_du | drain_delay | drain_rate | field_capacity_est |
|---|---|---|---|---|---|---|---|---|---|---|---|---|---|---|---|---|---|---|---|---|---|---|---|---|---|---|---|---|---|
| 2026-03-03 07:50:01+08:00 | 148 | 470 | Ws_W77 | 1.034556 | 30 | 470.02 | 469.75 | 471.19 | 471.25 | 3900.0 | 4060.0 | 70 | 0.0 | 0.0 | -0.05 | 0.361837 | 0.457143 | 32.0 | True | -16.2 | 3.6 | 32.0 | 0.0 | 0 | 0.0 | 40 | 1518 | -1.630501 | NaN |