| 2026-03-05 08:11:25+08:00 |
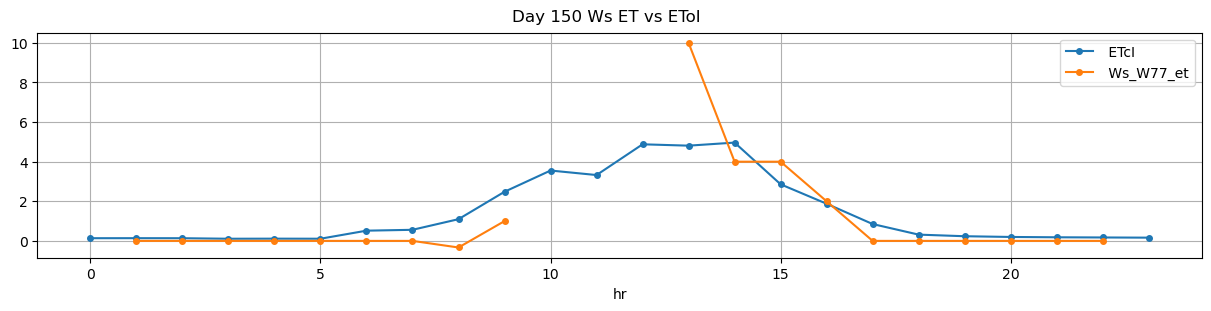
150 |
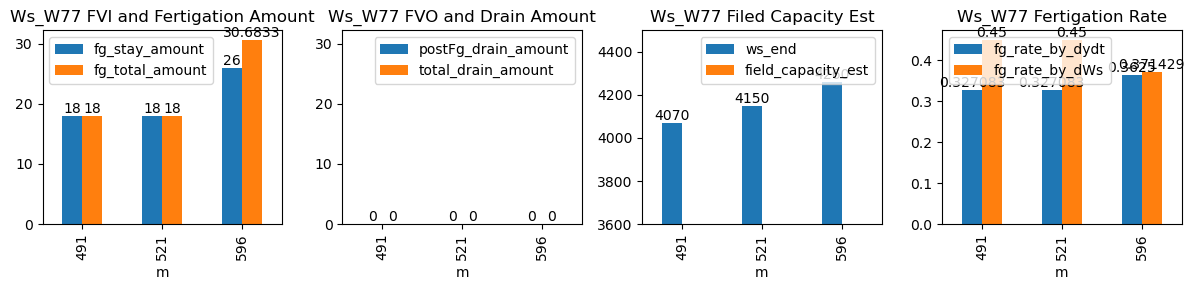
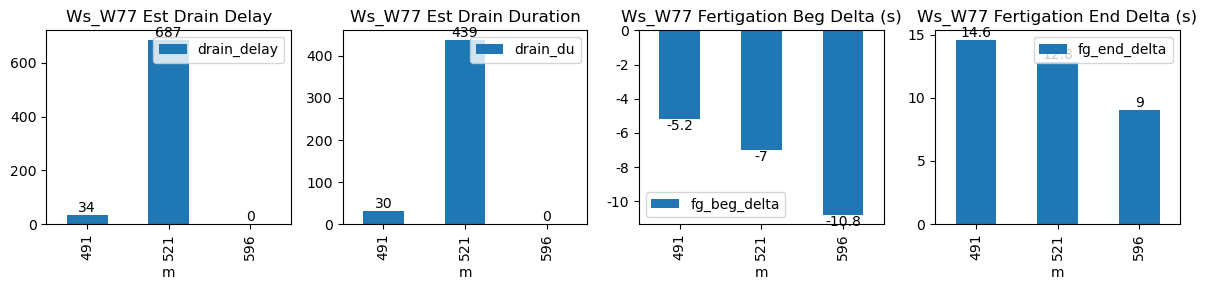
491 |
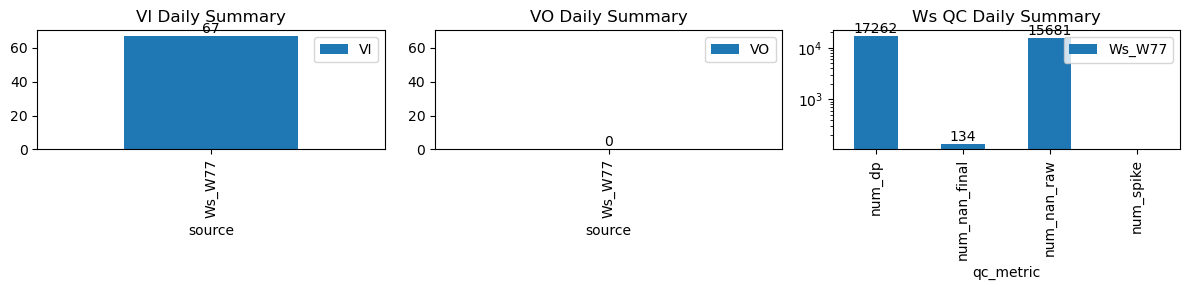
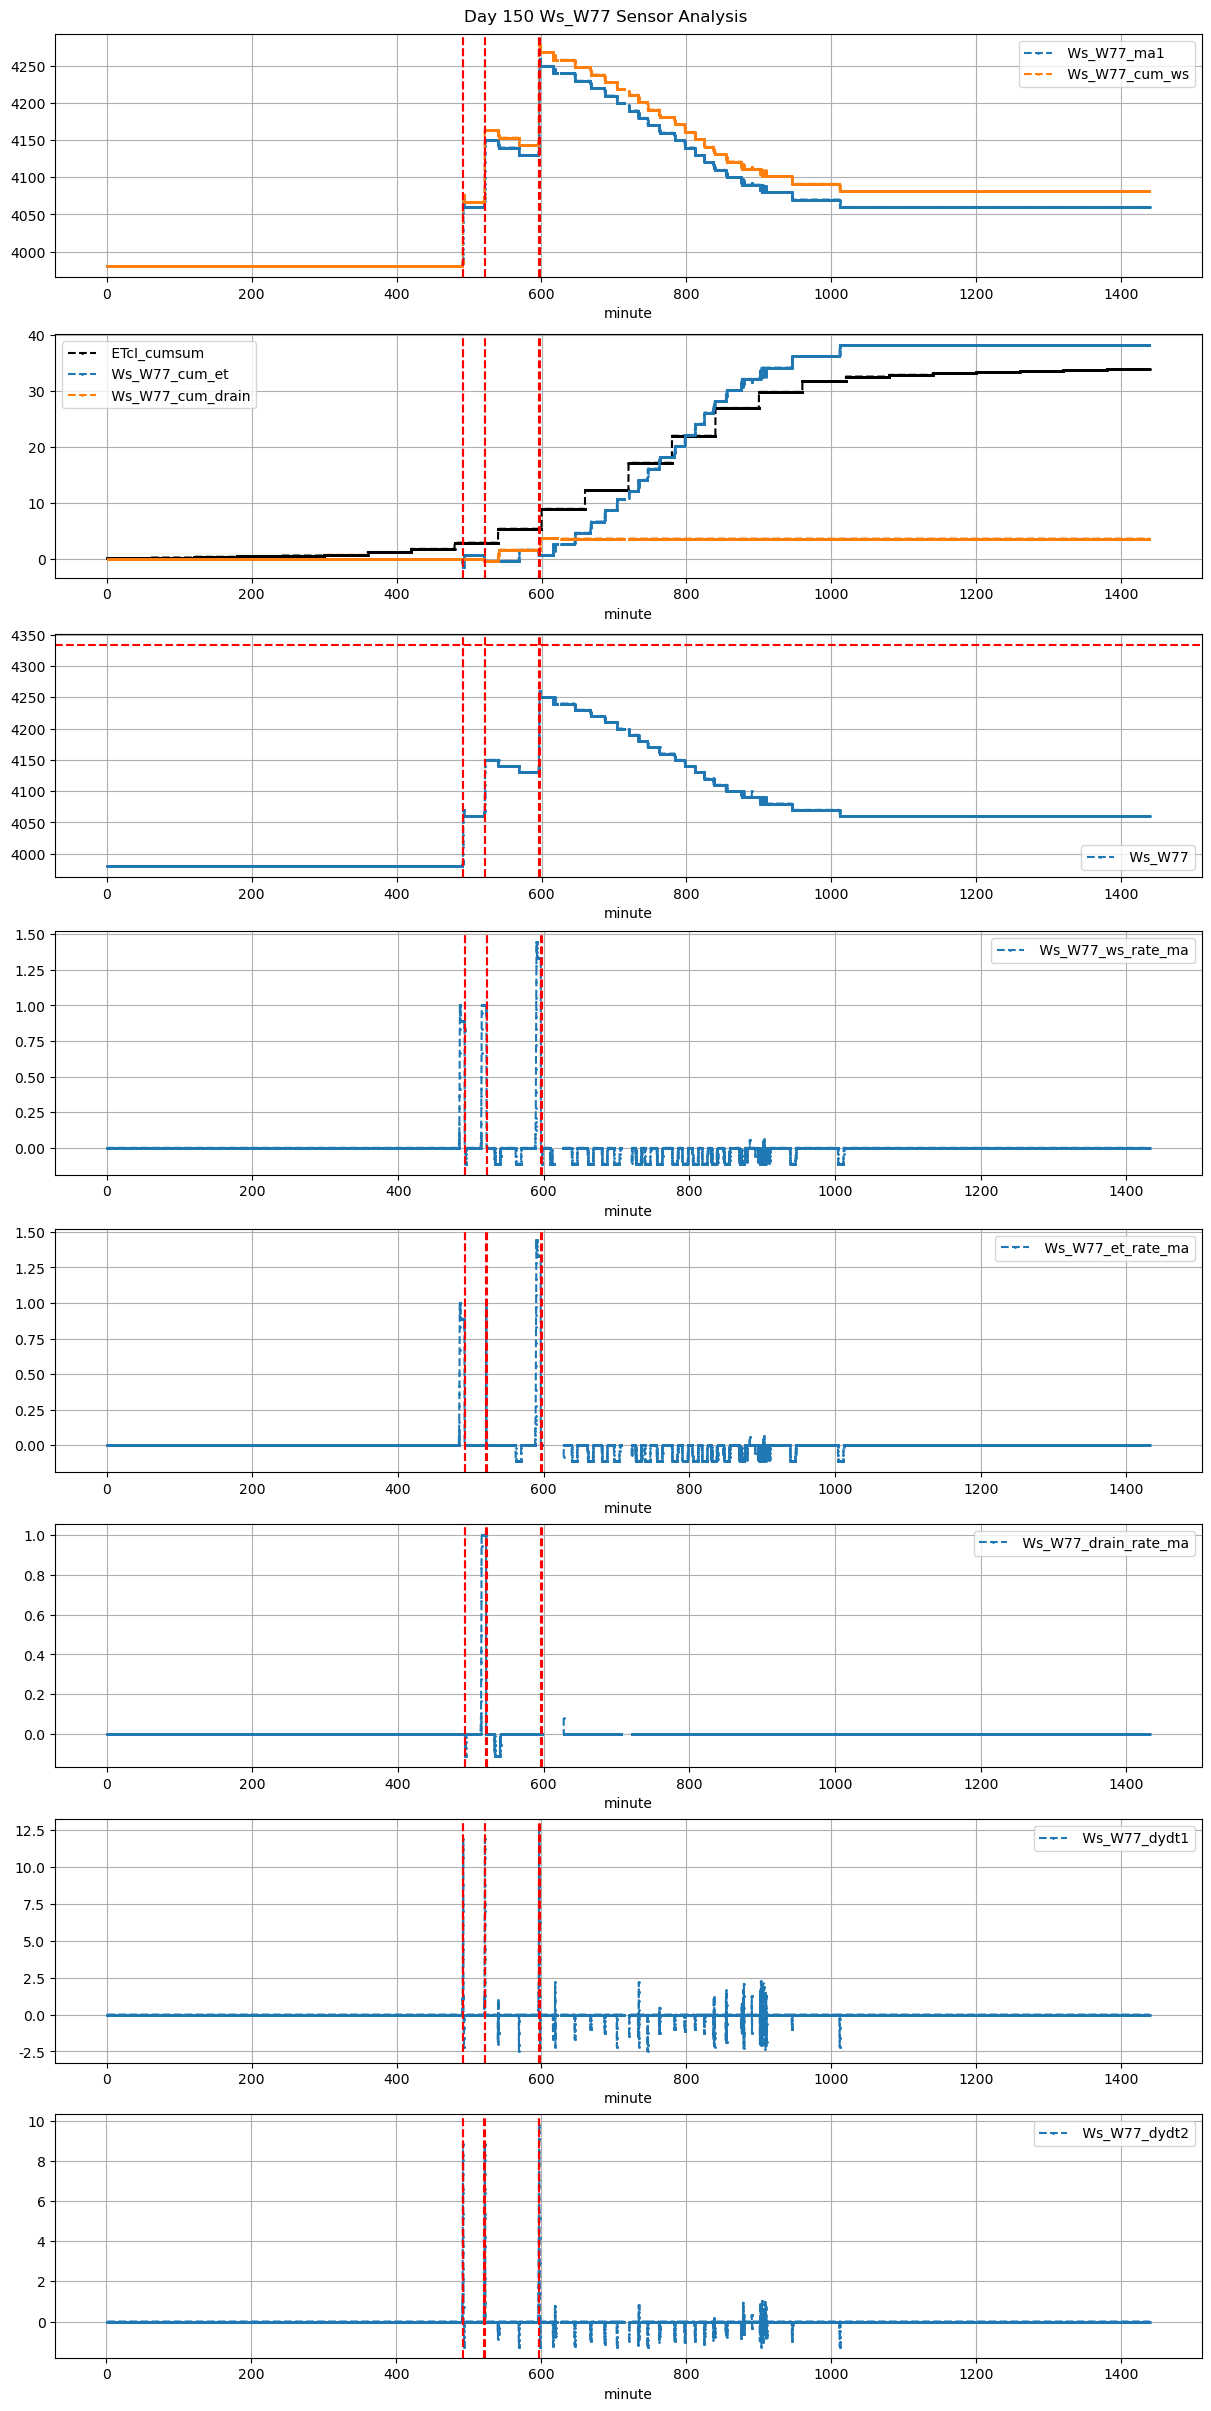
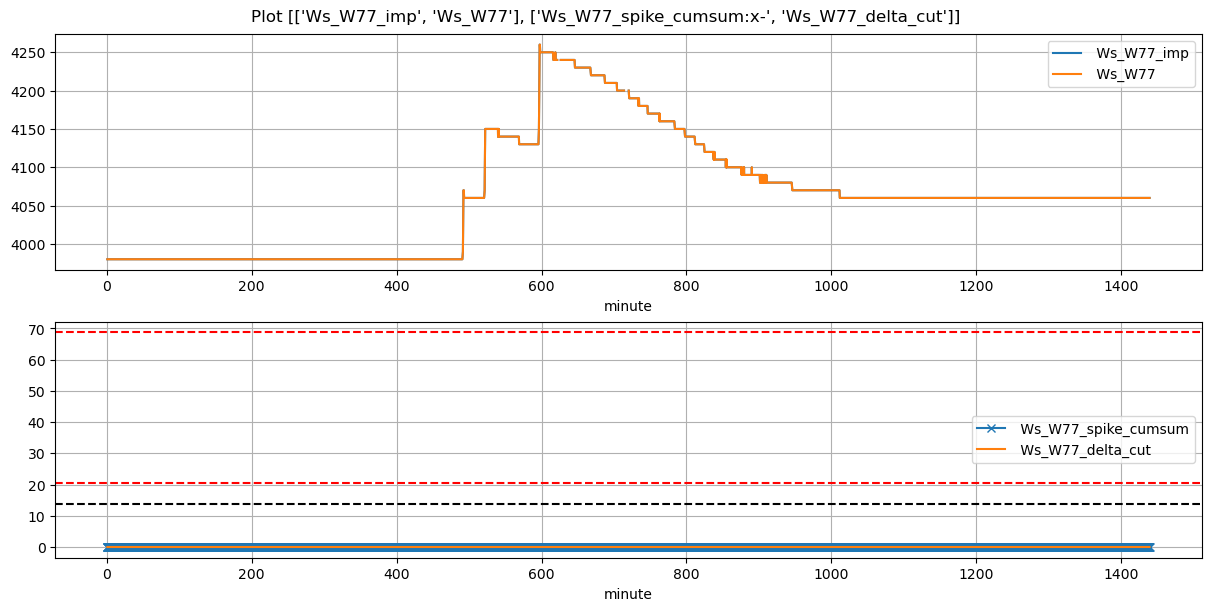
Ws_W77 |
1.676312 |
28.833333 |
491.42 |
491.333333 |
492.09 |
492.166667 |
3980.0 |
4070.0 |
40 |
0.0 |
-0.026389 |
0.000000 |
0.33125 |
0.450000 |
18.0 |
True |
-5.2 |
4.6 |
18.00 |
0.0 |
0 |
0.0 |
34 |
39 |
-0.93750 |
NaN |
| 2026-03-05 08:41:27+08:00 |
150 |
521 |
Ws_W77 |
1.676312 |
30.000000 |
521.45 |
521.333333 |
522.12 |
522.166667 |
4060.0 |
4150.0 |
40 |
0.0 |
0.000000 |
0.000000 |
0.33125 |
0.450000 |
18.0 |
True |
-7.0 |
2.8 |
18.00 |
0.0 |
0 |
0.0 |
9 |
1092 |
-1.93125 |
NaN |
| 2026-03-05 09:56:11+08:00 |
150 |
596 |
Ws_W77 |
1.676312 |
30.000000 |
596.18 |
596.000000 |
597.35 |
597.333333 |
4130.0 |
4260.0 |
70 |
0.0 |
-0.019444 |
-0.109722 |
0.36250 |
0.371429 |
26.0 |
True |
-10.8 |
-1.0 |
29.61 |
0.0 |
0 |
0.0 |
25 |
33 |
-2.18750 |
NaN |