| 2026-03-06 08:10:00+08:00 |
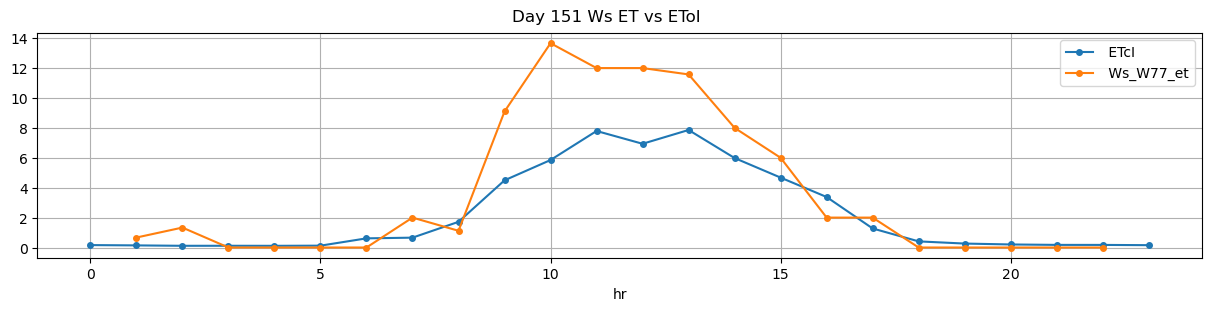
151 |
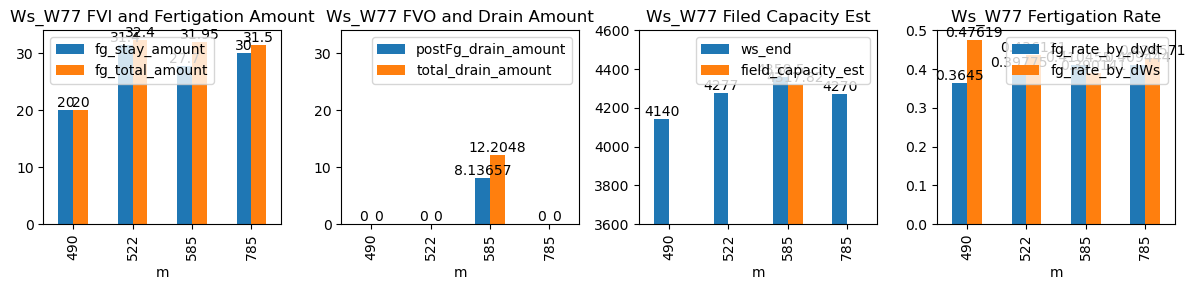
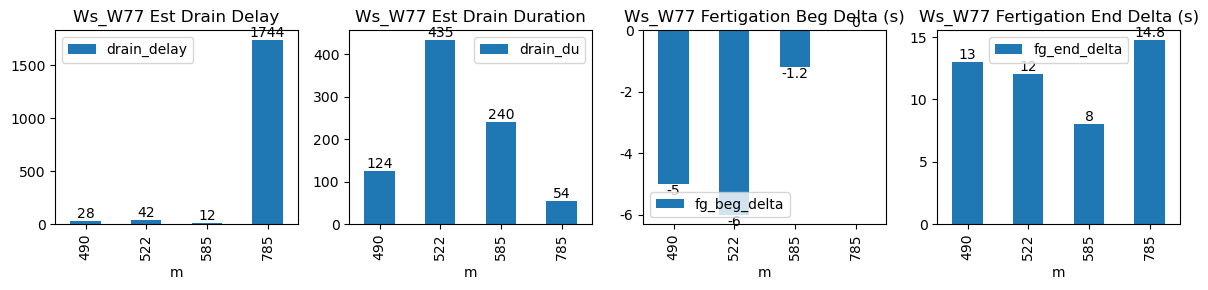
490 |
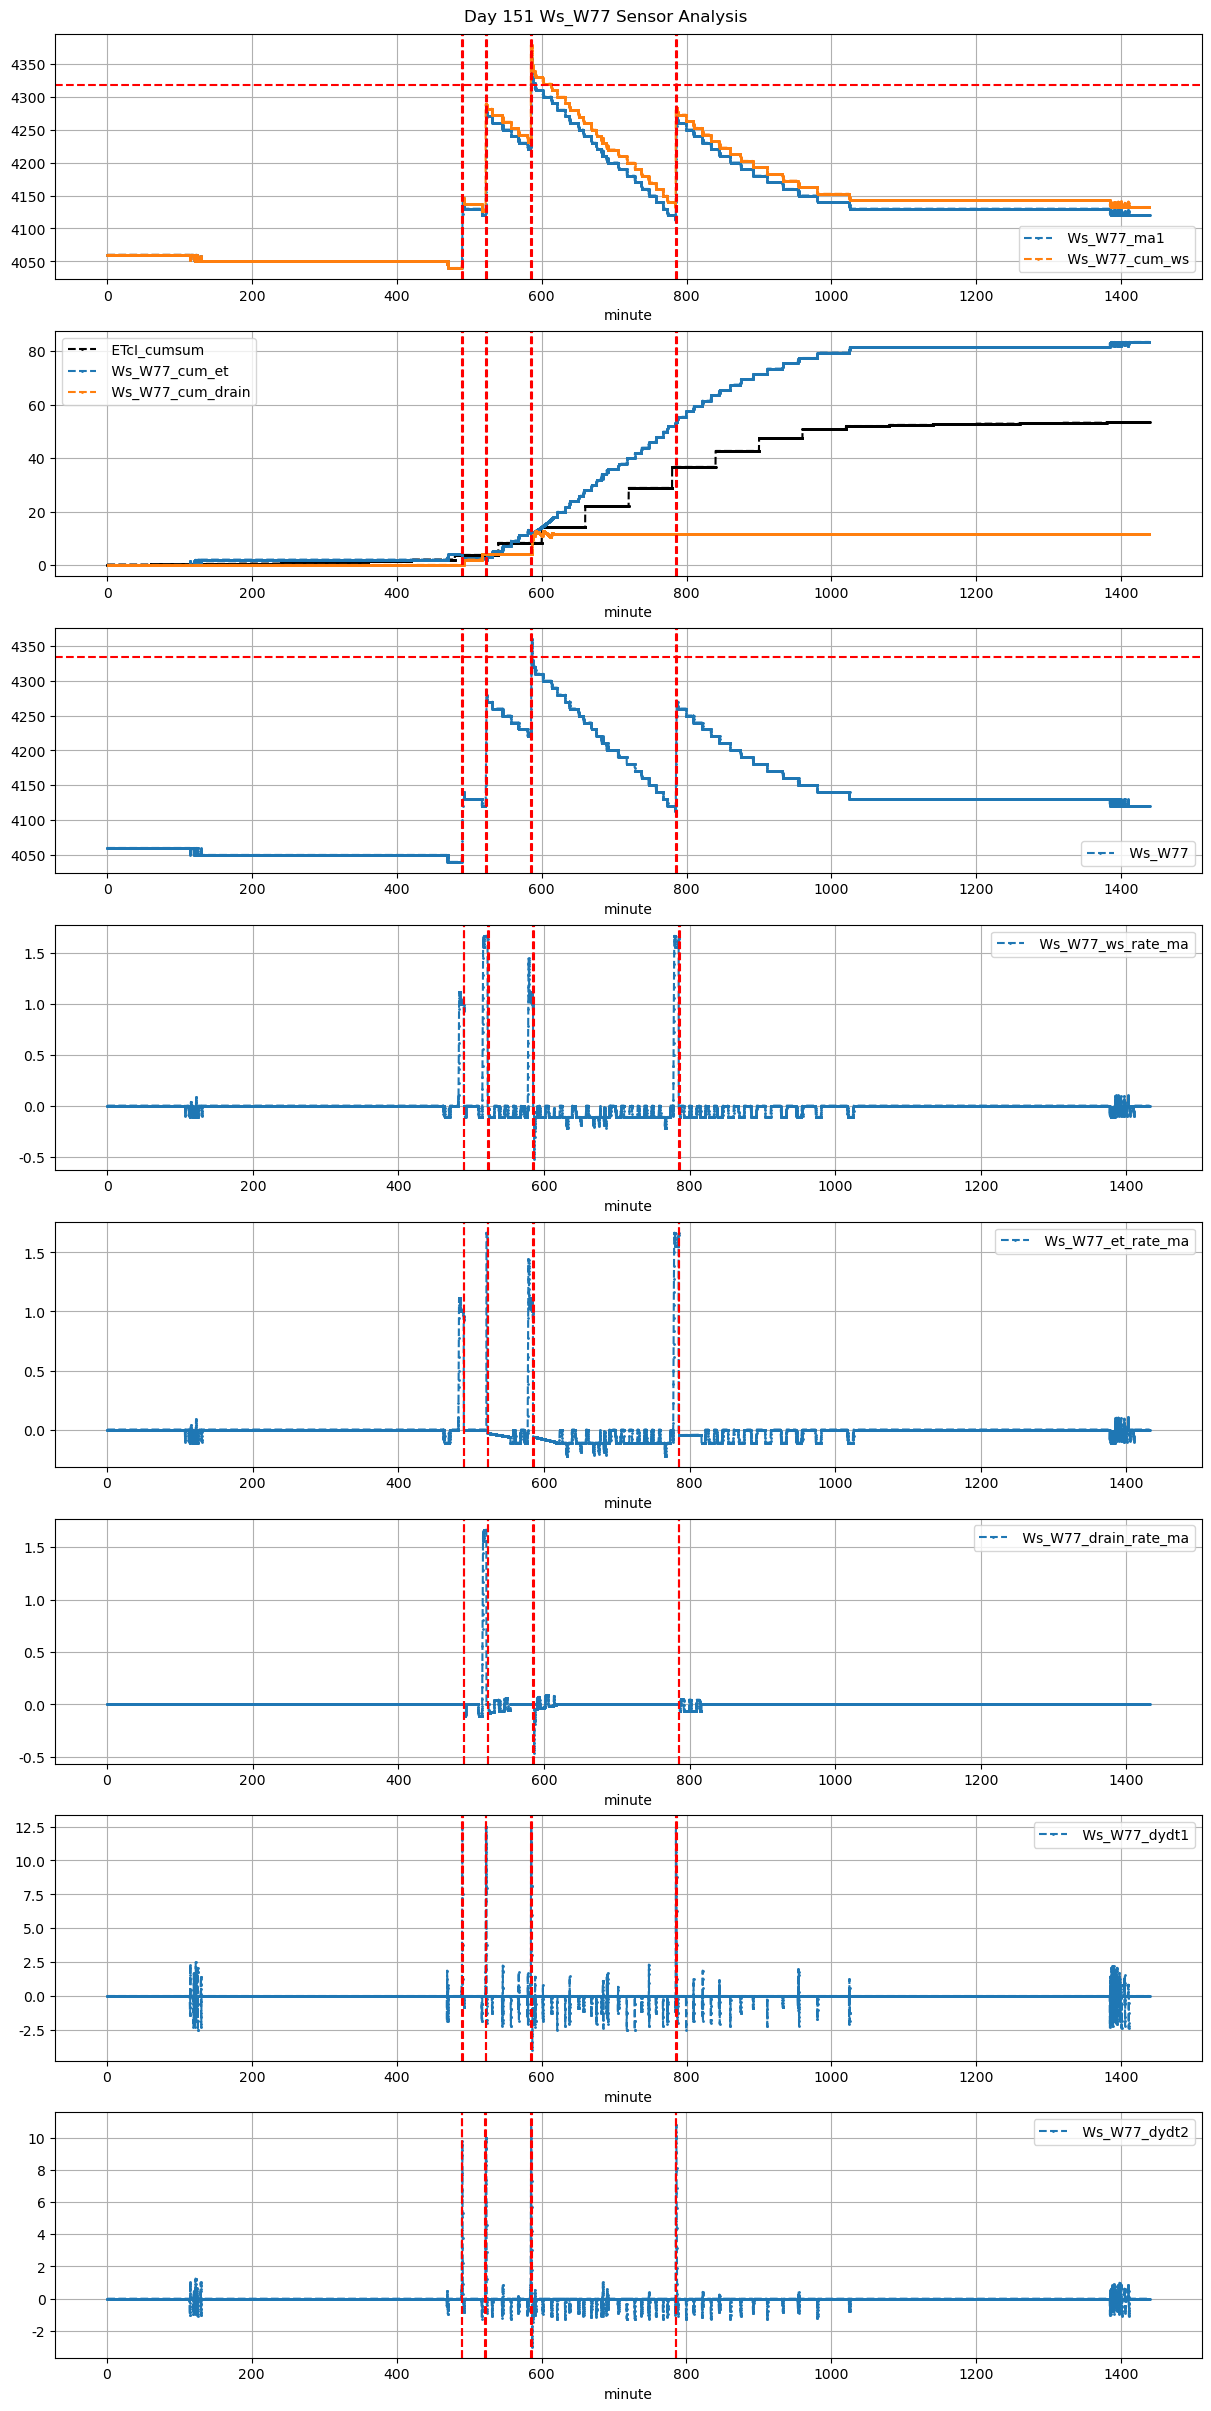
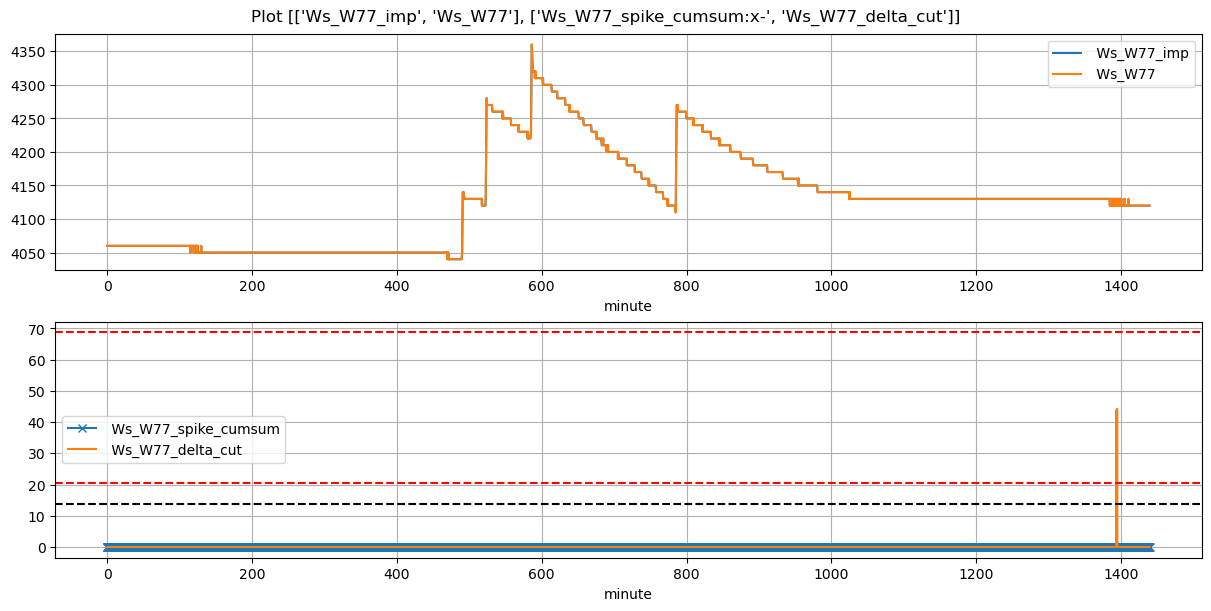
Ws_W77 |
2.046997 |
30 |
490.00 |
489.916667 |
490.70 |
490.750000 |
4040.0 |
4140.0 |
42 |
0.000000 |
-0.065278 |
0.000000 |
0.370000 |
0.476190 |
20.0 |
True |
-5.0 |
3.0 |
20.00 |
0.000000 |
0.000000 |
0.000000 |
39 |
1593 |
-1.750000 |
NaN |
| 2026-03-06 08:42:36+08:00 |
151 |
522 |
Ws_W77 |
2.046997 |
30 |
522.60 |
522.500000 |
523.80 |
523.833333 |
4120.0 |
4280.0 |
72 |
-0.159181 |
-0.080556 |
-0.044444 |
0.399250 |
0.444444 |
32.0 |
True |
-6.0 |
2.0 |
32.40 |
0.000000 |
0.000000 |
0.000000 |
20 |
1312 |
-1.929287 |
NaN |
| 2026-03-06 09:45:01+08:00 |
151 |
585 |
Ws_W77 |
2.046997 |
30 |
585.02 |
585.000000 |
586.20 |
586.166667 |
4220.0 |
4360.0 |
71 |
-0.137904 |
-0.250000 |
-0.077778 |
0.414205 |
0.394366 |
28.0 |
True |
-1.2 |
-2.0 |
31.95 |
2.595726 |
5.191452 |
7.787178 |
75 |
37 |
-2.895057 |
4334.042741 |
| 2026-03-06 13:05:00+08:00 |
151 |
785 |
Ws_W77 |
2.046997 |
30 |
785.00 |
785.000000 |
786.17 |
786.250000 |
4120.0 |
4270.0 |
70 |
-0.014831 |
-0.044444 |
0.000000 |
0.412500 |
0.428571 |
30.0 |
True |
0.0 |
4.8 |
31.50 |
0.000000 |
0.000000 |
0.000000 |
20 |
794 |
-2.075046 |
NaN |