| 2026-03-07 08:38:05+08:00 |
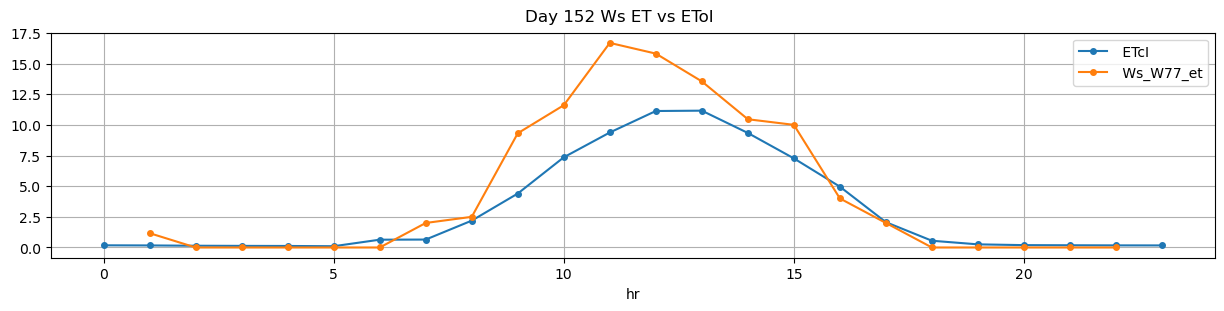
152 |
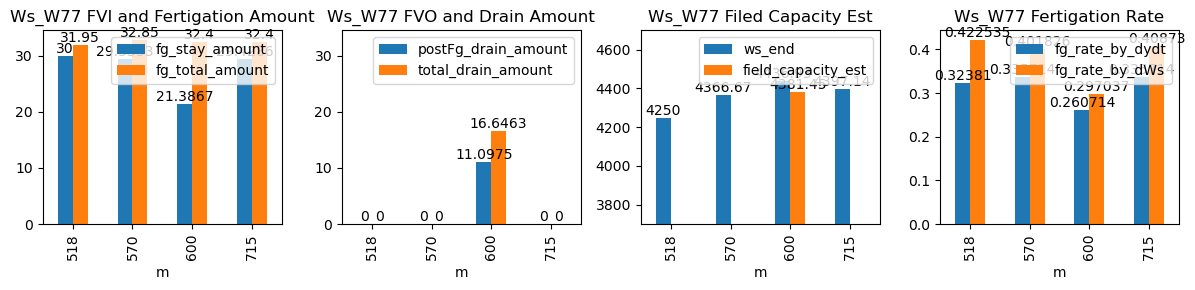
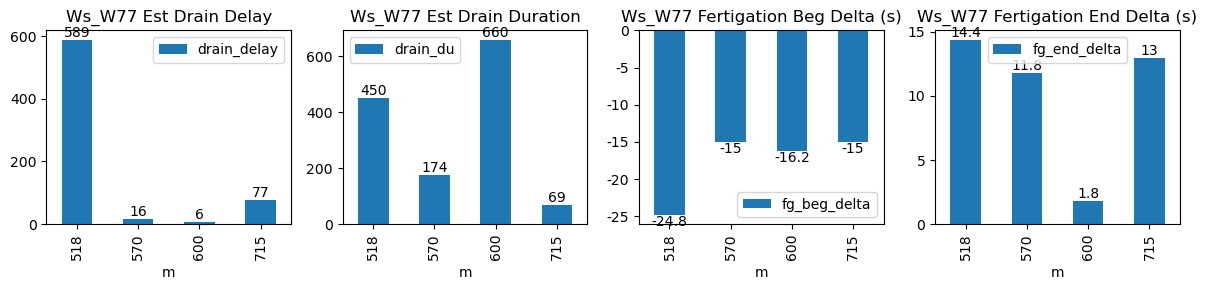
518 |
Ws_W77 |
1.2738 |
30.000000 |
518.08 |
517.666667 |
519.26 |
519.500000 |
4100.0 |
4250.000000 |
71 |
-0.059774 |
0.000000 |
-0.076543 |
0.323810 |
0.422535 |
30.000000 |
True |
-24.8 |
14.4 |
31.95 |
0.000000 |
0.000000 |
0.000000 |
450 |
589 |
-0.084971 |
NaN |
| 2026-03-07 09:30:00+08:00 |
152 |
570 |
Ws_W77 |
1.2738 |
28.583333 |
570.00 |
569.750000 |
571.22 |
571.416667 |
4220.0 |
4366.666667 |
73 |
-0.068290 |
-0.070473 |
0.000000 |
0.335714 |
0.401826 |
29.333333 |
True |
-15.0 |
11.8 |
32.85 |
0.000000 |
0.000000 |
0.000000 |
174 |
16 |
-0.054865 |
NaN |
| 2026-03-07 10:00:01+08:00 |
152 |
600 |
Ws_W77 |
1.2738 |
30.000000 |
600.02 |
599.750000 |
601.22 |
601.250000 |
4330.0 |
4436.933333 |
72 |
-0.051073 |
-0.205556 |
-0.098868 |
0.260714 |
0.297037 |
21.386667 |
True |
-16.2 |
1.8 |
32.40 |
5.548757 |
11.097515 |
16.646272 |
660 |
6 |
-0.169052 |
4381.44576 |
| 2026-03-07 11:55:00+08:00 |
152 |
715 |
Ws_W77 |
1.2738 |
30.000000 |
715.00 |
714.750000 |
716.20 |
716.416667 |
4250.0 |
4397.142857 |
72 |
-0.118227 |
-0.134127 |
-0.122716 |
0.335714 |
0.408730 |
29.428571 |
True |
-15.0 |
13.0 |
32.40 |
0.000000 |
0.000000 |
0.000000 |
69 |
77 |
-0.103796 |
NaN |