| 2026-03-08 08:06:24+08:00 |
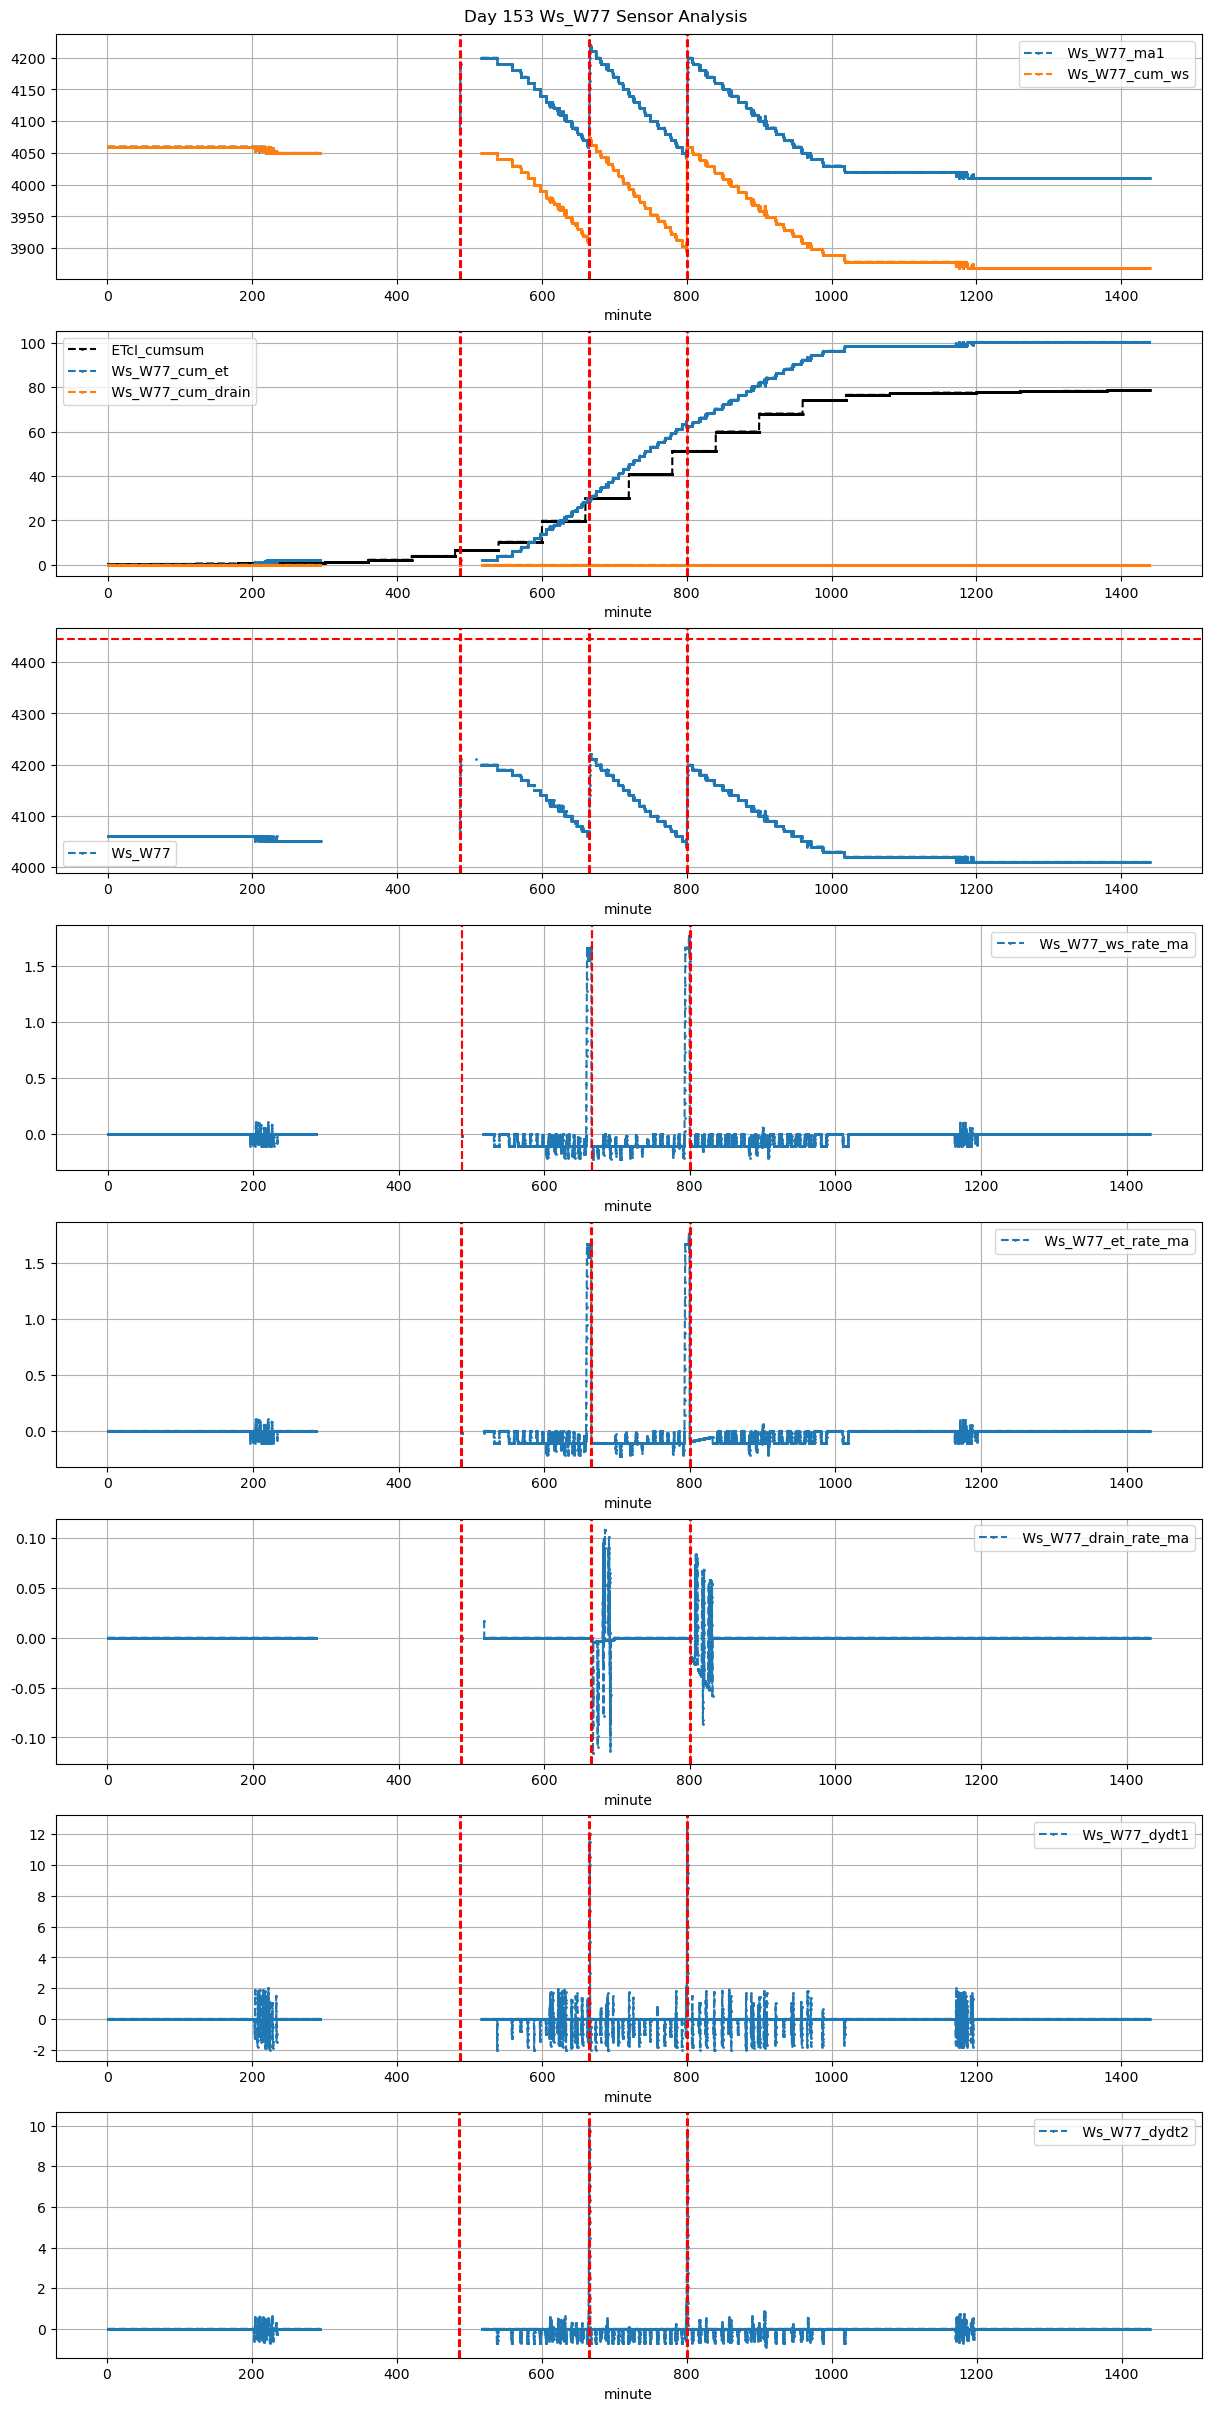
153 |
486 |
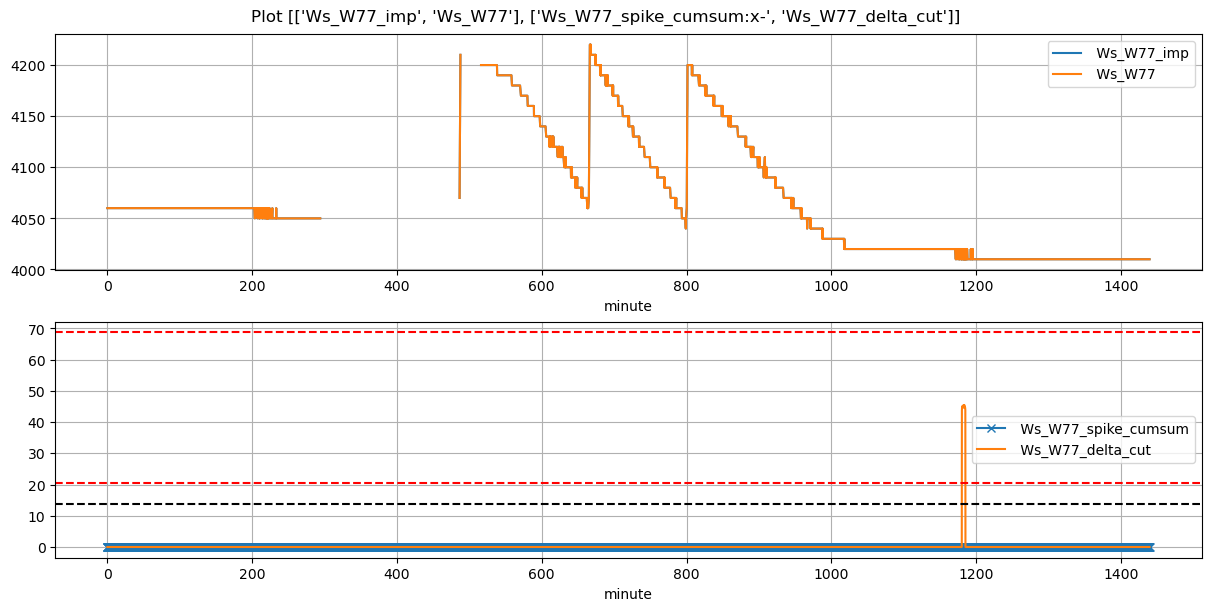
Ws_W77 |
1.16501 |
30 |
486.40 |
NaN |
487.63 |
487.75 |
NaN |
4210.0 |
74 |
NaN |
NaN |
NaN |
NaN |
NaN |
NaN |
False |
NaN |
7.2 |
NaN |
0.0 |
NaN |
NaN |
NaN |
NaN |
NaN |
NaN |
| 2026-03-08 11:05:01+08:00 |
153 |
665 |
Ws_W77 |
1.16501 |
30 |
665.02 |
664.833333 |
666.22 |
666.25 |
4060.0 |
4220.0 |
72 |
-0.083731 |
-0.098611 |
-0.113889 |
0.379026 |
0.444444 |
32.0 |
True |
-11.2 |
1.8 |
32.4 |
0.0 |
0.0 |
0.0 |
24.0 |
66.0 |
-1.891177 |
NaN |
| 2026-03-08 13:20:01+08:00 |
153 |
800 |
Ws_W77 |
1.16501 |
30 |
800.02 |
799.833333 |
801.22 |
801.25 |
4050.0 |
4200.0 |
72 |
-0.119586 |
-0.119444 |
-0.025000 |
0.358810 |
0.416667 |
30.0 |
True |
-11.2 |
1.8 |
32.4 |
0.0 |
0.0 |
0.0 |
24.0 |
1021.0 |
-1.713861 |
NaN |