| 2026-03-15 08:20:41+08:00 |
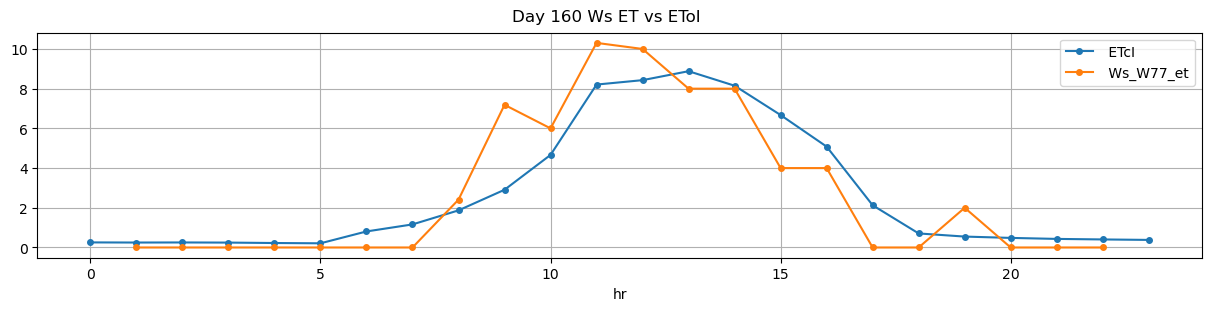
160 |
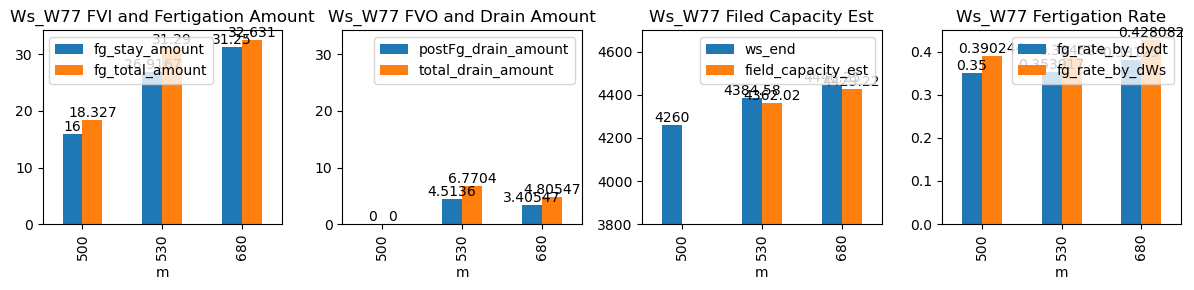
500 |
Ws_W77 |
1.836332 |
28.416667 |
500.68 |
500.750000 |
501.36 |
501.583333 |
4180.0 |
4260.000000 |
41 |
0.000000 |
-0.019136 |
0.000000 |
0.350000 |
0.390244 |
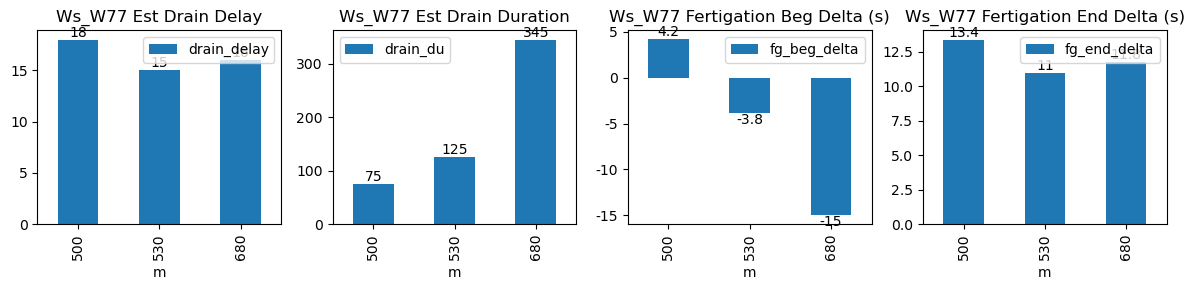
16.000000 |
True |
4.2 |
13.4 |
18.327 |
0.000000 |
0.000000 |
0.000000 |
75 |
18 |
-0.111111 |
NaN |
| 2026-03-15 08:50:44+08:00 |
160 |
530 |
Ws_W77 |
1.836332 |
30.000000 |
530.73 |
530.666667 |
531.90 |
532.083333 |
4250.0 |
4384.583333 |
70 |
-0.020194 |
-0.037654 |
-0.083333 |
0.353917 |
0.384524 |
26.916667 |
True |
-3.8 |
11.0 |
31.290 |
2.256799 |
4.513597 |
6.770396 |
125 |
15 |
-0.139174 |
4362.015346 |
| 2026-03-15 11:20:00+08:00 |
160 |
680 |
Ws_W77 |
1.836332 |
30.000000 |
680.00 |
679.750000 |
681.22 |
681.416667 |
4290.0 |
4446.250000 |
73 |
-0.057636 |
-0.100617 |
-0.060185 |
0.381250 |
0.428082 |
31.250000 |
True |
-15.0 |
11.8 |
32.631 |
1.400000 |
3.405472 |
4.805472 |
345 |
16 |
-0.082408 |
4429.222638 |