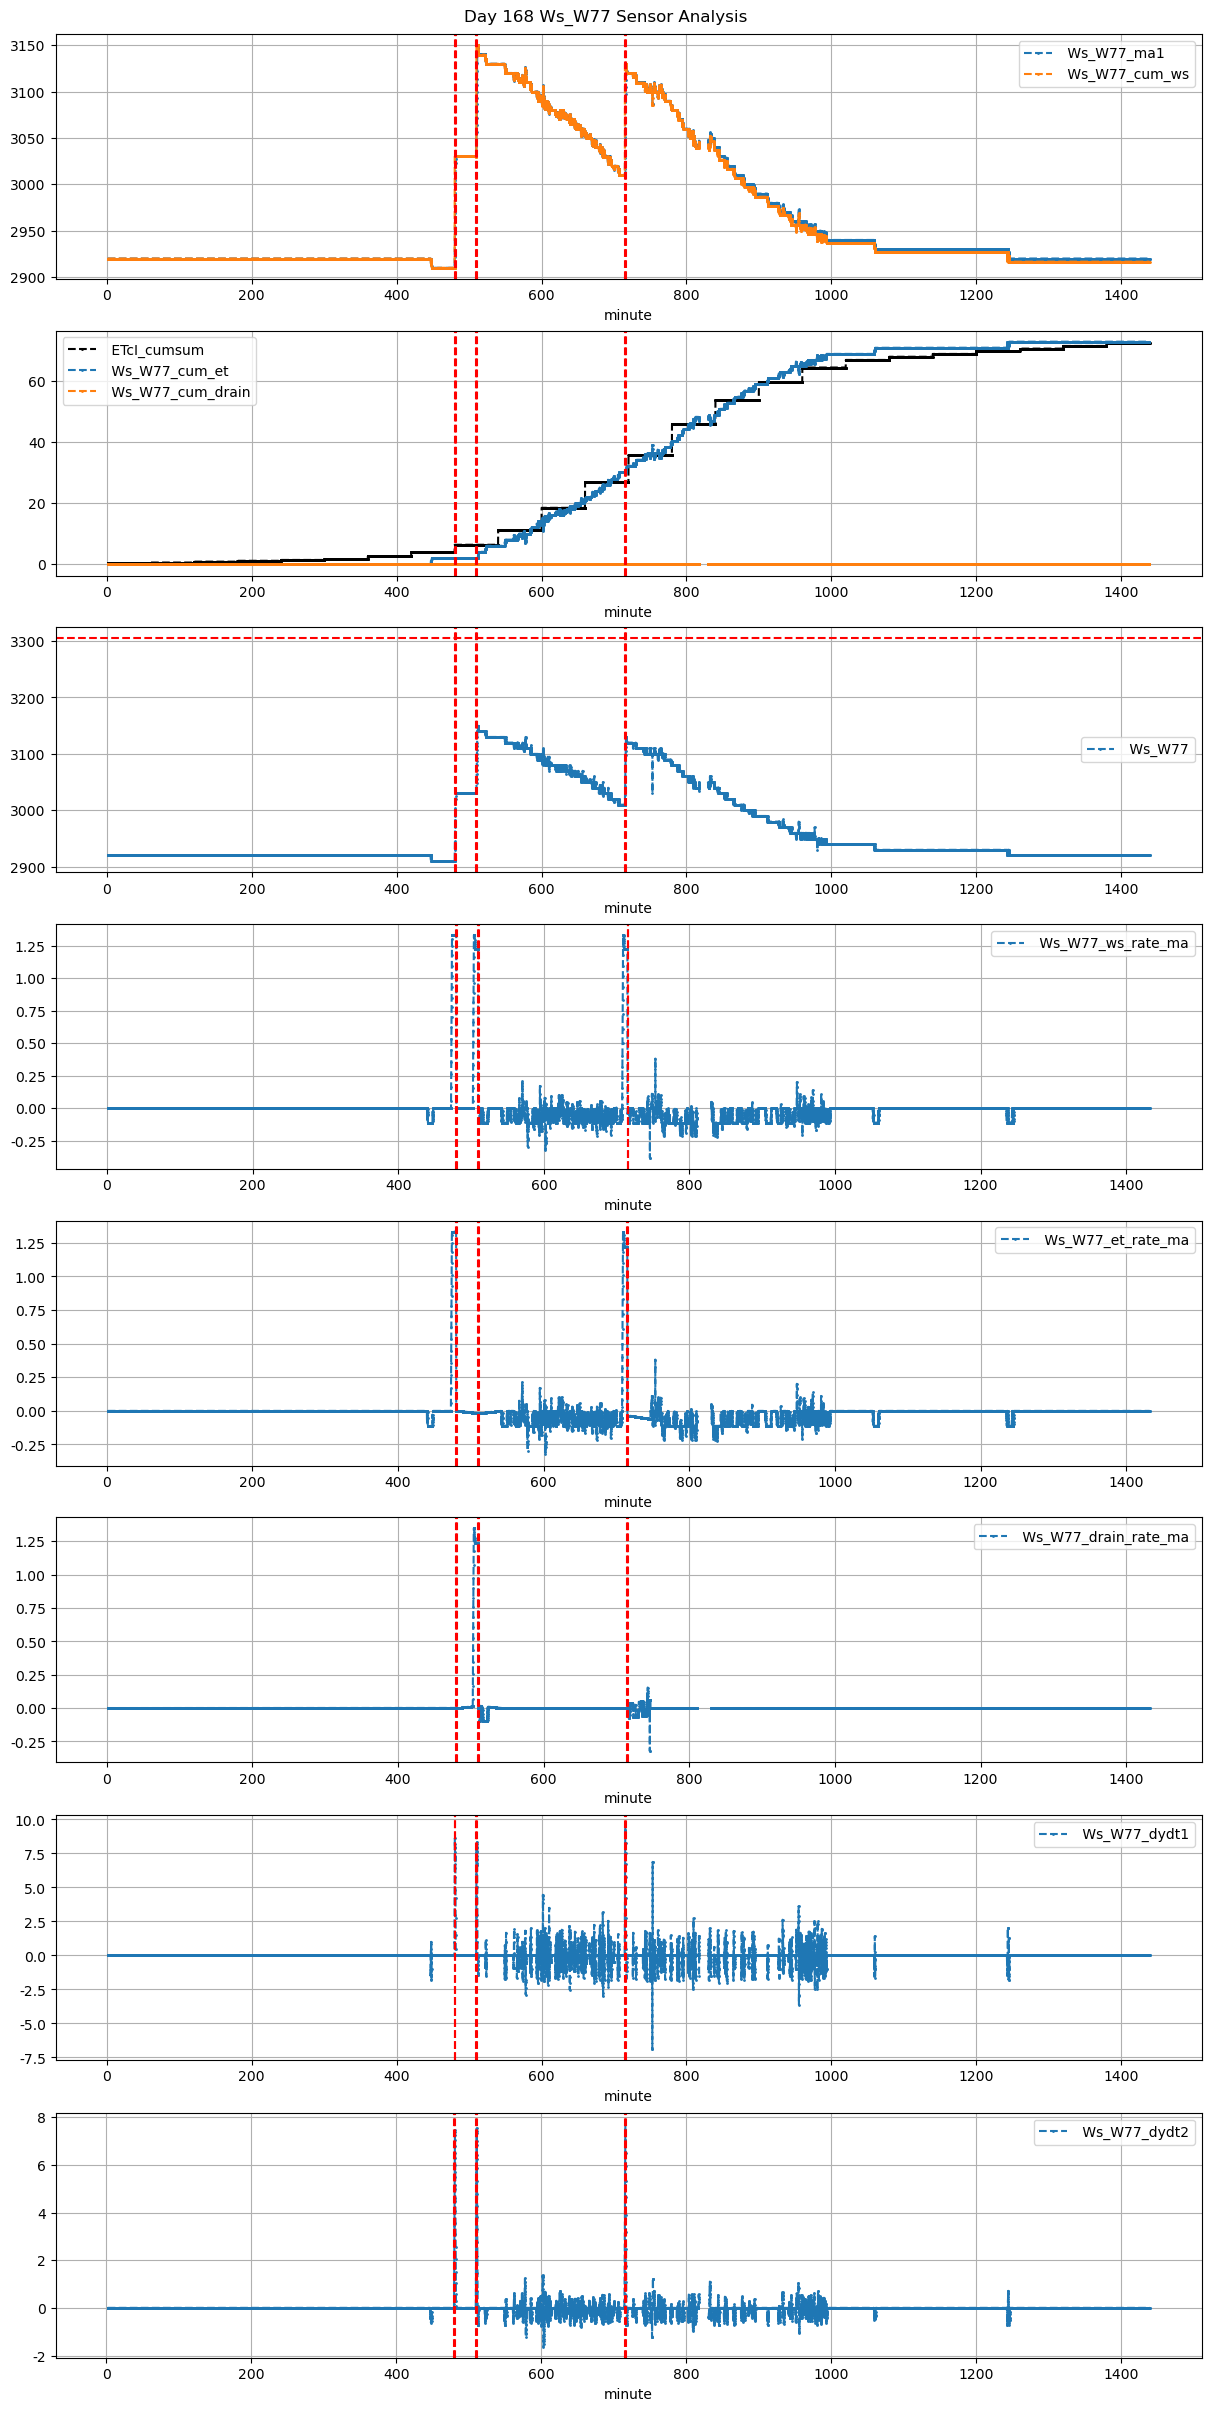
| 2026-03-23 08:00:00+08:00 |
168 |
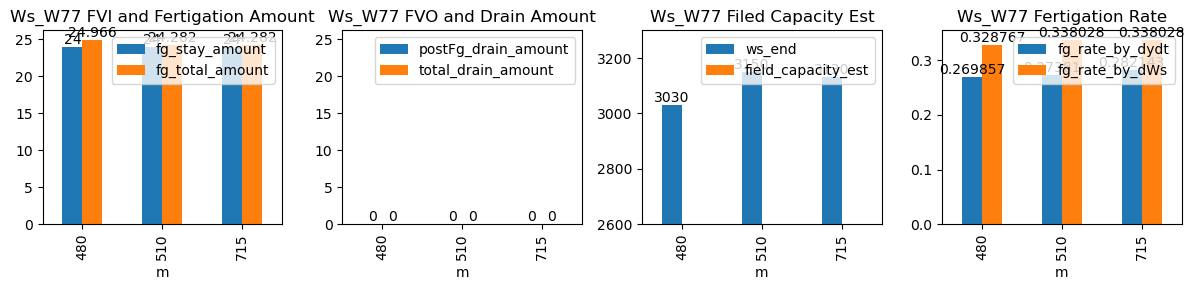
480 |
Ws_W77 |
1.036182 |
28.5 |
480.0 |
479.750000 |
481.22 |
481.500000 |
2910.0 |
3030.0 |
73 |
0.000000 |
0.000000 |
0.000000 |
0.269857 |
0.328767 |
24.0 |
True |
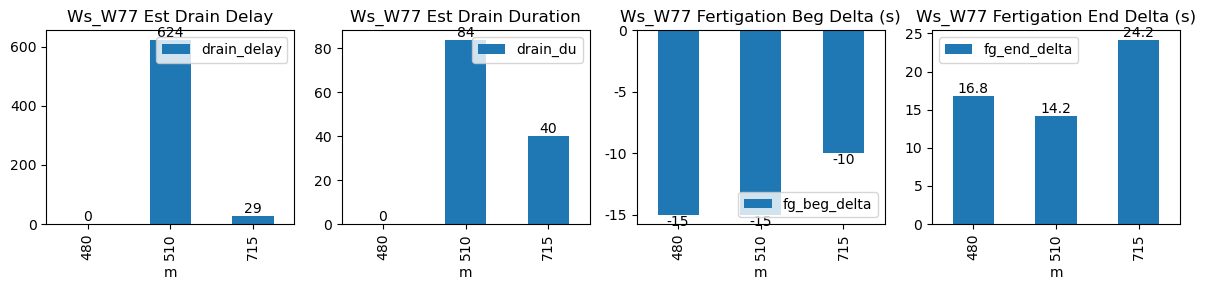
-15.0 |
16.8 |
24.966 |
0.0 |
0 |
0.0 |
NaN |
NaN |
NaN |
NaN |
| 2026-03-23 08:30:00+08:00 |
168 |
510 |
Ws_W77 |
1.036182 |
30.0 |
510.0 |
509.750000 |
511.18 |
511.416667 |
3030.0 |
3150.0 |
71 |
-0.016931 |
-0.066545 |
0.000000 |
0.273810 |
0.338028 |
24.0 |
True |
-15.0 |
14.2 |
24.282 |
0.0 |
0 |
0.0 |
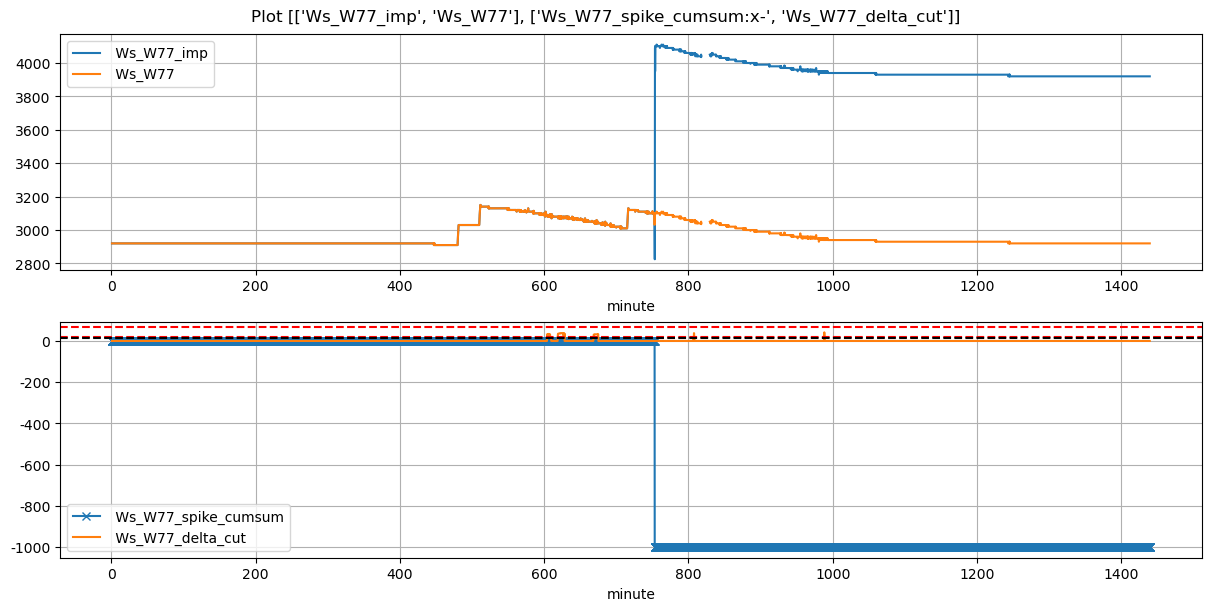
84.0 |
624.0 |
-0.099876 |
NaN |
| 2026-03-23 11:55:00+08:00 |
168 |
715 |
Ws_W77 |
1.036182 |
30.0 |
715.0 |
714.833333 |
716.18 |
716.583333 |
3010.0 |
3130.0 |
71 |
-0.094257 |
-0.034877 |
-0.059722 |
0.282143 |
0.338028 |
24.0 |
True |
-10.0 |
24.2 |
24.282 |
0.0 |
0 |
0.0 |
40.0 |
29.0 |
-0.070656 |
NaN |