| 2026-03-22 08:55:00+08:00 |
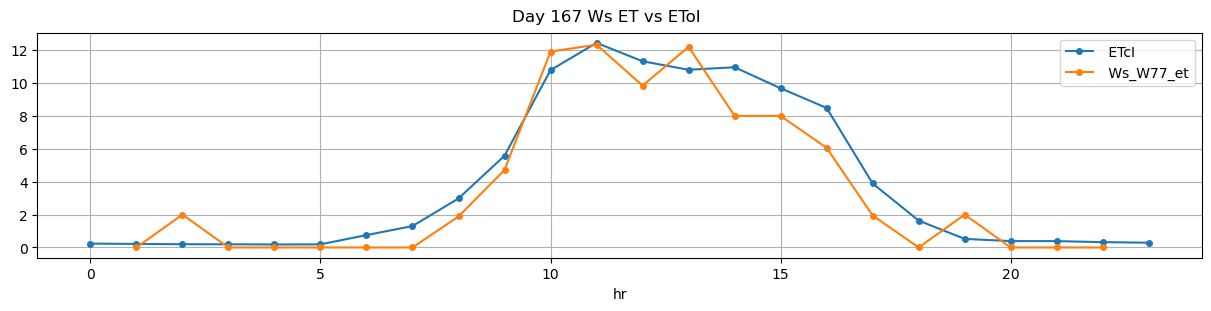
167 |
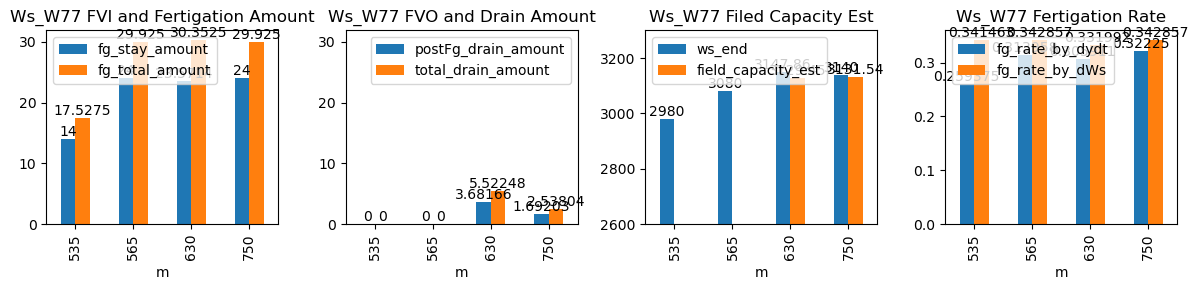
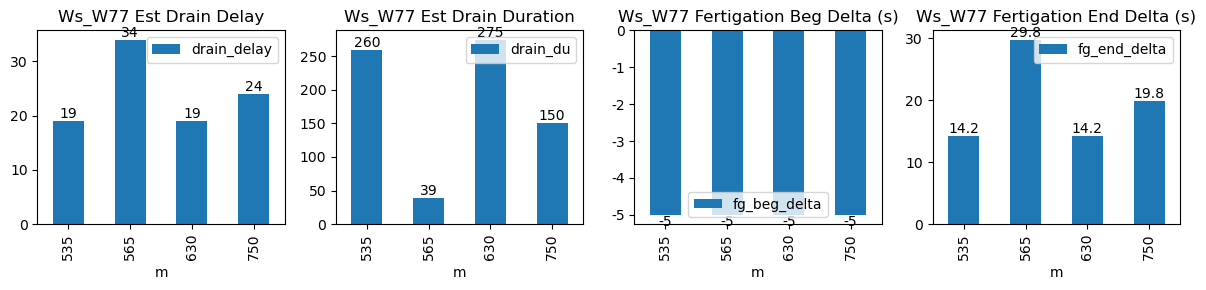
535 |
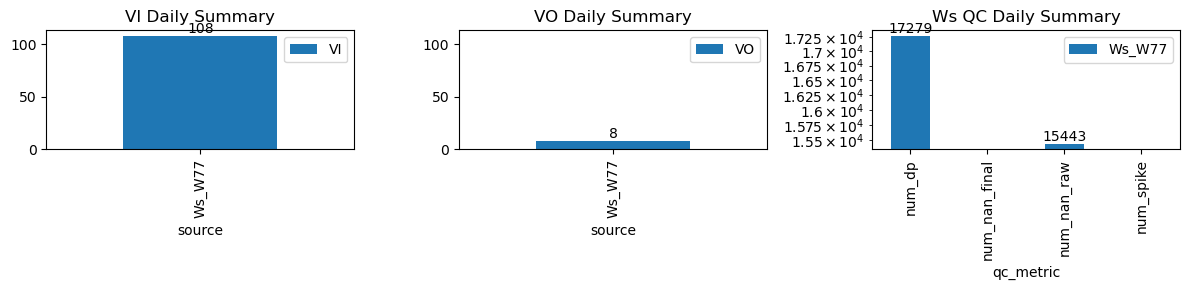
Ws_W77 |
1.487455 |
29.083333 |
535.0 |
534.916667 |
535.68 |
535.916667 |
2910.0 |
2980.000000 |
41 |
0.000000 |
-0.064300 |
0.000000 |
0.259375 |
0.341463 |
14.000000 |
True |
-5.0 |
14.2 |
17.5275 |
0.000000 |
0.000000 |
0.000000 |
260 |
19 |
-0.110781 |
NaN |
| 2026-03-22 09:25:00+08:00 |
167 |
565 |
Ws_W77 |
1.487455 |
30.000000 |
565.0 |
564.916667 |
566.17 |
566.666667 |
2960.0 |
3080.000000 |
70 |
-0.038731 |
-0.014198 |
-0.041667 |
0.313958 |
0.342857 |
24.000000 |
True |
-5.0 |
29.8 |
29.9250 |
0.000000 |
0.000000 |
0.000000 |
39 |
34 |
-0.085375 |
NaN |
| 2026-03-22 10:30:00+08:00 |
167 |
630 |
Ws_W77 |
1.487455 |
30.000000 |
630.0 |
629.916667 |
631.18 |
631.416667 |
3030.0 |
3147.857143 |
71 |
-0.076259 |
-0.108524 |
-0.096296 |
0.305911 |
0.331992 |
23.571429 |
True |
-5.0 |
14.2 |
30.3525 |
1.840828 |
3.681656 |
5.522485 |
275 |
19 |
-0.076595 |
3129.448861 |
| 2026-03-22 12:30:00+08:00 |
167 |
750 |
Ws_W77 |
1.487455 |
30.000000 |
750.0 |
749.916667 |
751.17 |
751.500000 |
3020.0 |
3140.000000 |
70 |
-0.105727 |
-0.124691 |
-0.054321 |
0.322250 |
0.342857 |
24.000000 |
True |
-5.0 |
19.8 |
29.9250 |
0.846015 |
1.692029 |
2.538044 |
150 |
24 |
-0.101095 |
3131.539853 |