| 2026-03-12 08:03:48+08:00 |
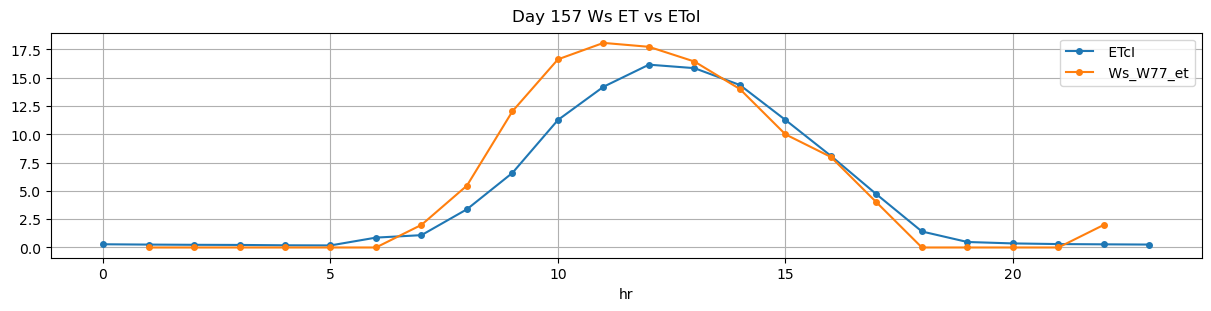
157 |
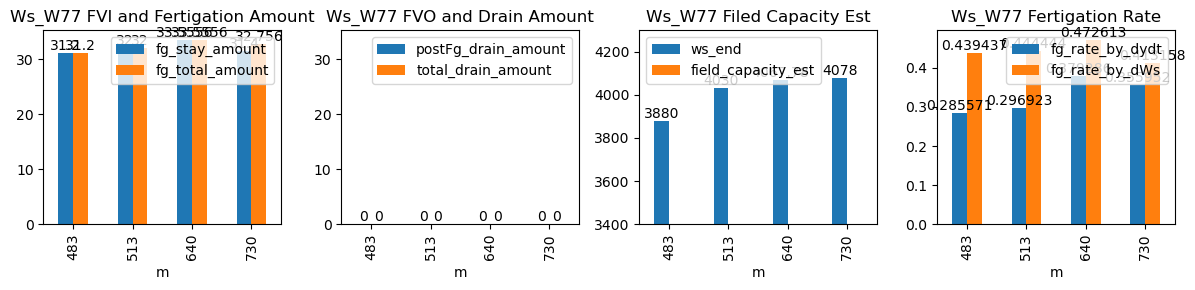
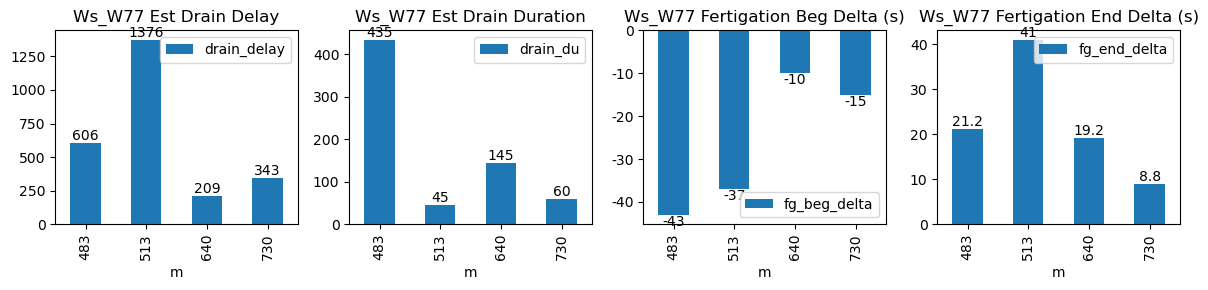
483 |
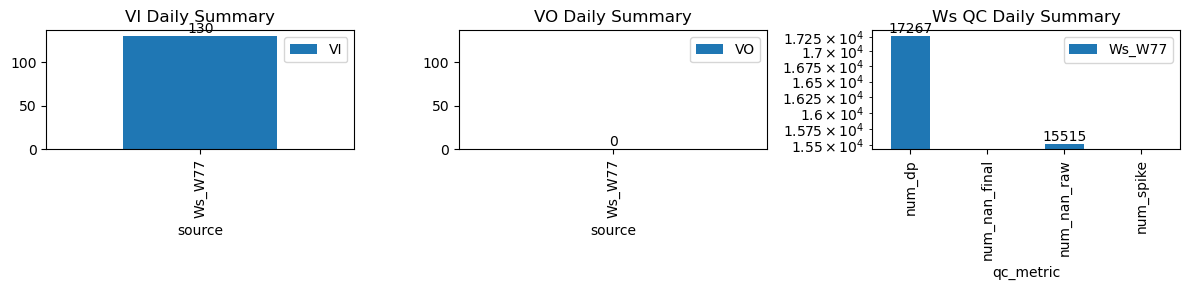
Ws_W77 |
1.171143 |
27.833333 |
483.8 |
483.083333 |
484.98 |
485.166667 |
3721.894737 |
3880.0 |
71 |
-0.058757 |
0.000000 |
0.000000 |
0.287143 |
0.445367 |
31.621053 |
True |
-43.0 |
11.2 |
31.621053 |
0.0 |
0 |
0.0 |
35 |
981 |
-1.029167 |
NaN |
| 2026-03-12 08:33:42+08:00 |
157 |
513 |
Ws_W77 |
1.171143 |
30.000000 |
513.7 |
513.083333 |
514.90 |
515.416667 |
3870.000000 |
4030.0 |
72 |
0.000000 |
-0.123333 |
0.000000 |
0.299912 |
0.444444 |
32.000000 |
True |
-37.0 |
31.0 |
32.000000 |
0.0 |
0 |
0.0 |
15 |
1341 |
-1.400000 |
NaN |
| 2026-03-12 10:40:00+08:00 |
157 |
640 |
Ws_W77 |
1.171143 |
30.000000 |
640.0 |
639.833333 |
641.18 |
641.333333 |
3900.000000 |
4070.0 |
71 |
-0.102542 |
-0.180556 |
-0.138889 |
0.387095 |
0.478873 |
34.000000 |
True |
-10.0 |
9.2 |
34.000000 |
0.0 |
0 |
0.0 |
24 |
304 |
-1.263590 |
NaN |
| 2026-03-12 12:10:00+08:00 |
157 |
730 |
Ws_W77 |
1.171143 |
30.000000 |
730.0 |
729.750000 |
731.27 |
731.250000 |
3920.000000 |
4080.0 |
76 |
-0.088277 |
-0.143750 |
-0.085417 |
0.362619 |
0.421053 |
32.000000 |
True |
-15.0 |
-1.2 |
32.756000 |
0.0 |
0 |
0.0 |
20 |
68 |
-1.342764 |
NaN |