| 2026-03-11 08:01:29+08:00 |
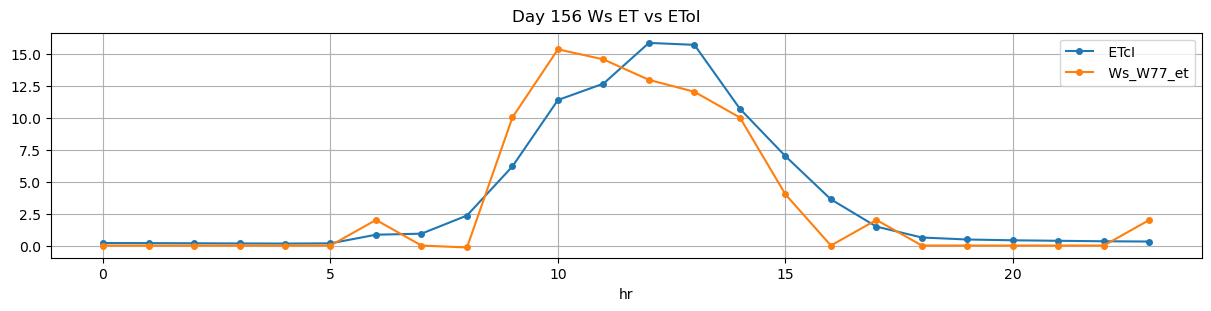
156 |
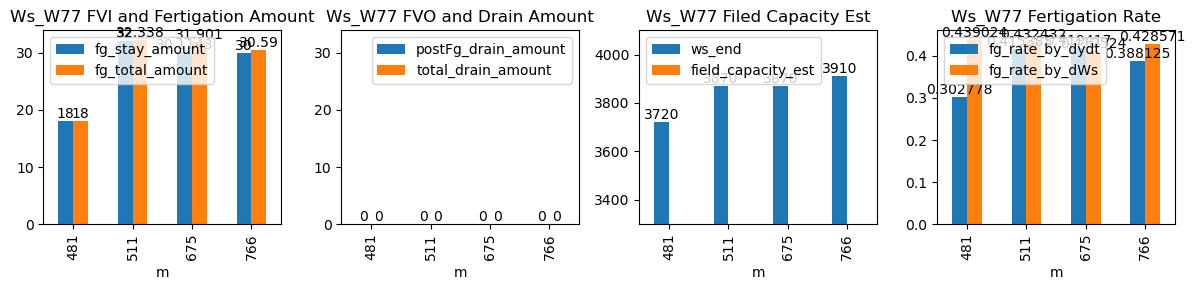
481 |
Ws_W77 |
1.787185 |
28.75 |
481.48 |
481.166667 |
482.16 |
482.25 |
3630.000000 |
3720.0 |
41 |
0.000000 |
0.000000 |
0.000000 |
0.307778 |
0.439024 |
18.000000 |
True |
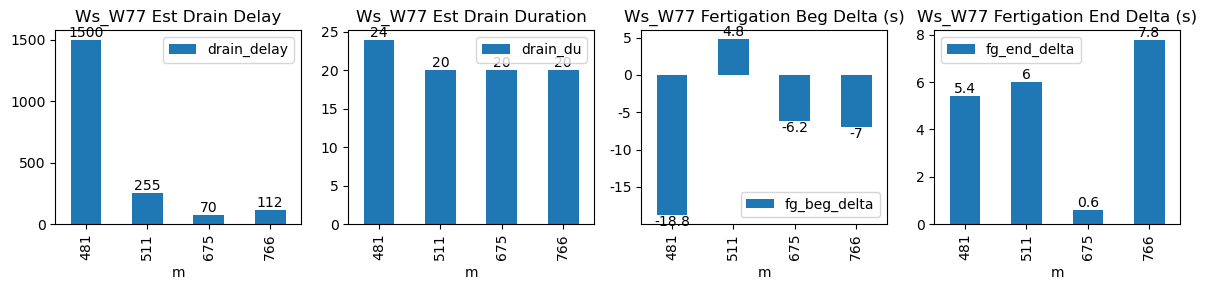
-18.8 |
5.4 |
18.000 |
0.0 |
0 |
0.0 |
24 |
1500 |
-2.145833 |
NaN |
| 2026-03-11 08:31:55+08:00 |
156 |
511 |
Ws_W77 |
1.787185 |
30.00 |
511.92 |
512.000000 |
513.15 |
513.25 |
3710.000000 |
3870.0 |
74 |
-0.147115 |
-0.127778 |
-0.073611 |
0.425000 |
0.432432 |
32.000000 |
True |
4.8 |
6.0 |
32.338 |
0.0 |
0 |
0.0 |
20 |
255 |
-1.718003 |
NaN |
| 2026-03-11 11:15:01+08:00 |
156 |
675 |
Ws_W77 |
1.787185 |
30.00 |
675.02 |
674.916667 |
676.24 |
676.25 |
3715.428571 |
3870.0 |
73 |
-0.118079 |
-0.145139 |
-0.123611 |
0.421417 |
0.423483 |
30.914286 |
True |
-6.2 |
0.6 |
31.901 |
0.0 |
0 |
0.0 |
20 |
70 |
-2.380597 |
NaN |
| 2026-03-11 12:46:12+08:00 |
156 |
766 |
Ws_W77 |
1.787185 |
30.00 |
766.20 |
766.083333 |
767.37 |
767.50 |
3760.000000 |
3910.0 |
70 |
-0.028249 |
-0.141512 |
-0.063194 |
0.395625 |
0.428571 |
30.000000 |
True |
-7.0 |
7.8 |
30.590 |
0.0 |
0 |
0.0 |
20 |
112 |
-2.463414 |
NaN |