| 2026-03-21 07:50:00+08:00 |
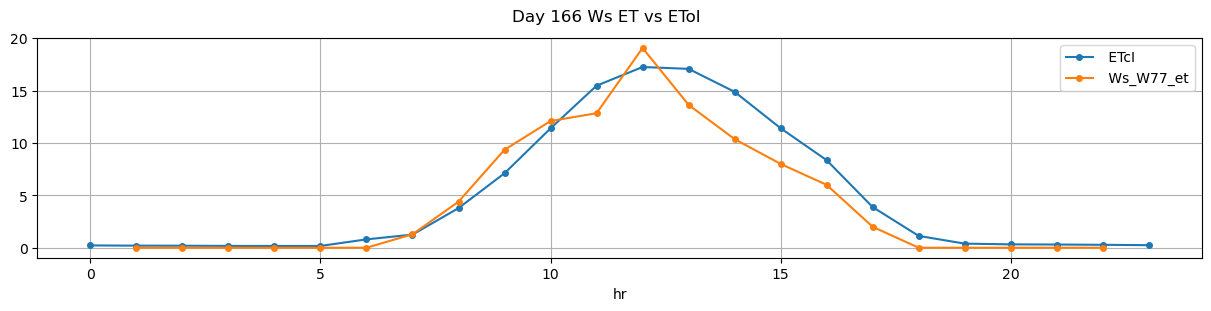
166 |
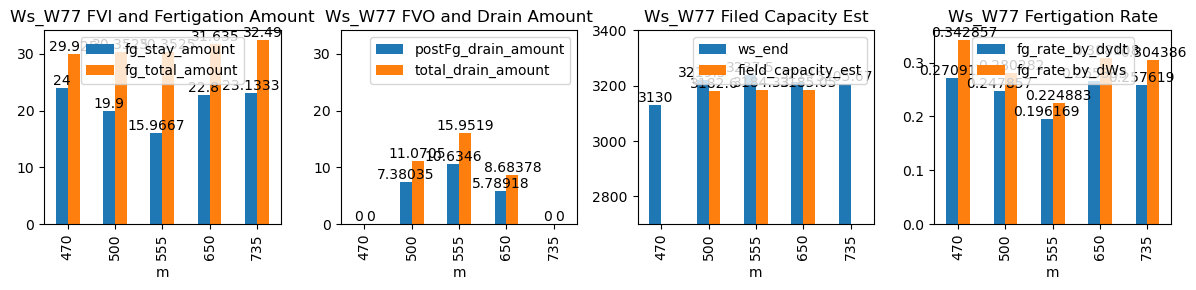
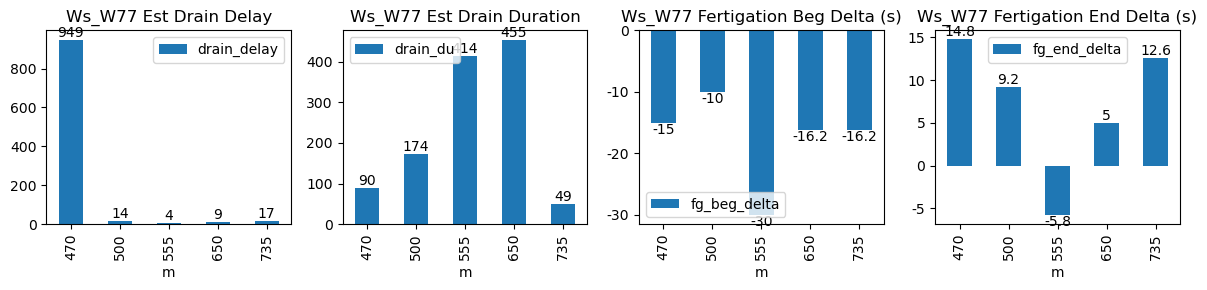
470 |
Ws_W77 |
1.445032 |
28.75 |
470.00 |
469.750000 |
471.17 |
471.250000 |
3010.0 |
3130.0 |
70 |
0.000000 |
0.000000 |
0.000000 |
0.272075 |
0.342857 |
24.0 |
True |
-15.0 |
4.8 |
29.960 |
0.00000 |
0.000000 |
0.000000 |
19 |
1229 |
-1.718712 |
NaN |
| 2026-03-21 08:20:00+08:00 |
166 |
500 |
Ws_W77 |
1.445032 |
30.00 |
500.00 |
499.833333 |
501.18 |
501.166667 |
3120.0 |
3220.0 |
71 |
-0.066384 |
-0.151157 |
-0.052469 |
0.248690 |
0.281690 |
20.0 |
True |
-10.0 |
-0.8 |
30.388 |
0.00000 |
6.656005 |
6.656005 |
100 |
24 |
-2.207224 |
NaN |
| 2026-03-21 09:15:00+08:00 |
166 |
555 |
Ws_W77 |
1.445032 |
30.00 |
555.00 |
554.500000 |
556.18 |
556.000000 |
3155.0 |
3240.0 |
71 |
-0.033898 |
-0.220833 |
-0.136111 |
0.197695 |
0.239437 |
17.0 |
True |
-30.0 |
-10.8 |
30.388 |
3.55972 |
7.119440 |
10.679160 |
125 |
19 |
-3.334820 |
3204.402801 |
| 2026-03-21 10:50:01+08:00 |
166 |
650 |
Ws_W77 |
1.445032 |
30.00 |
650.02 |
649.750000 |
651.25 |
651.333333 |
3100.0 |
3220.0 |
74 |
-0.142655 |
-0.171528 |
-0.062816 |
0.265333 |
0.324324 |
24.0 |
True |
-16.2 |
5.0 |
31.672 |
0.00000 |
0.000000 |
0.000000 |
50 |
15 |
-2.091968 |
NaN |
| 2026-03-21 12:15:01+08:00 |
166 |
735 |
Ws_W77 |
1.445032 |
30.00 |
735.02 |
734.750000 |
736.29 |
736.416667 |
3090.0 |
3210.0 |
76 |
-0.144303 |
-0.162269 |
-0.113194 |
0.259524 |
0.315789 |
24.0 |
True |
-16.2 |
7.6 |
32.528 |
0.00000 |
0.000000 |
0.000000 |
55 |
22 |
-2.341394 |
NaN |