| 2026-03-30 09:40:01+08:00 |
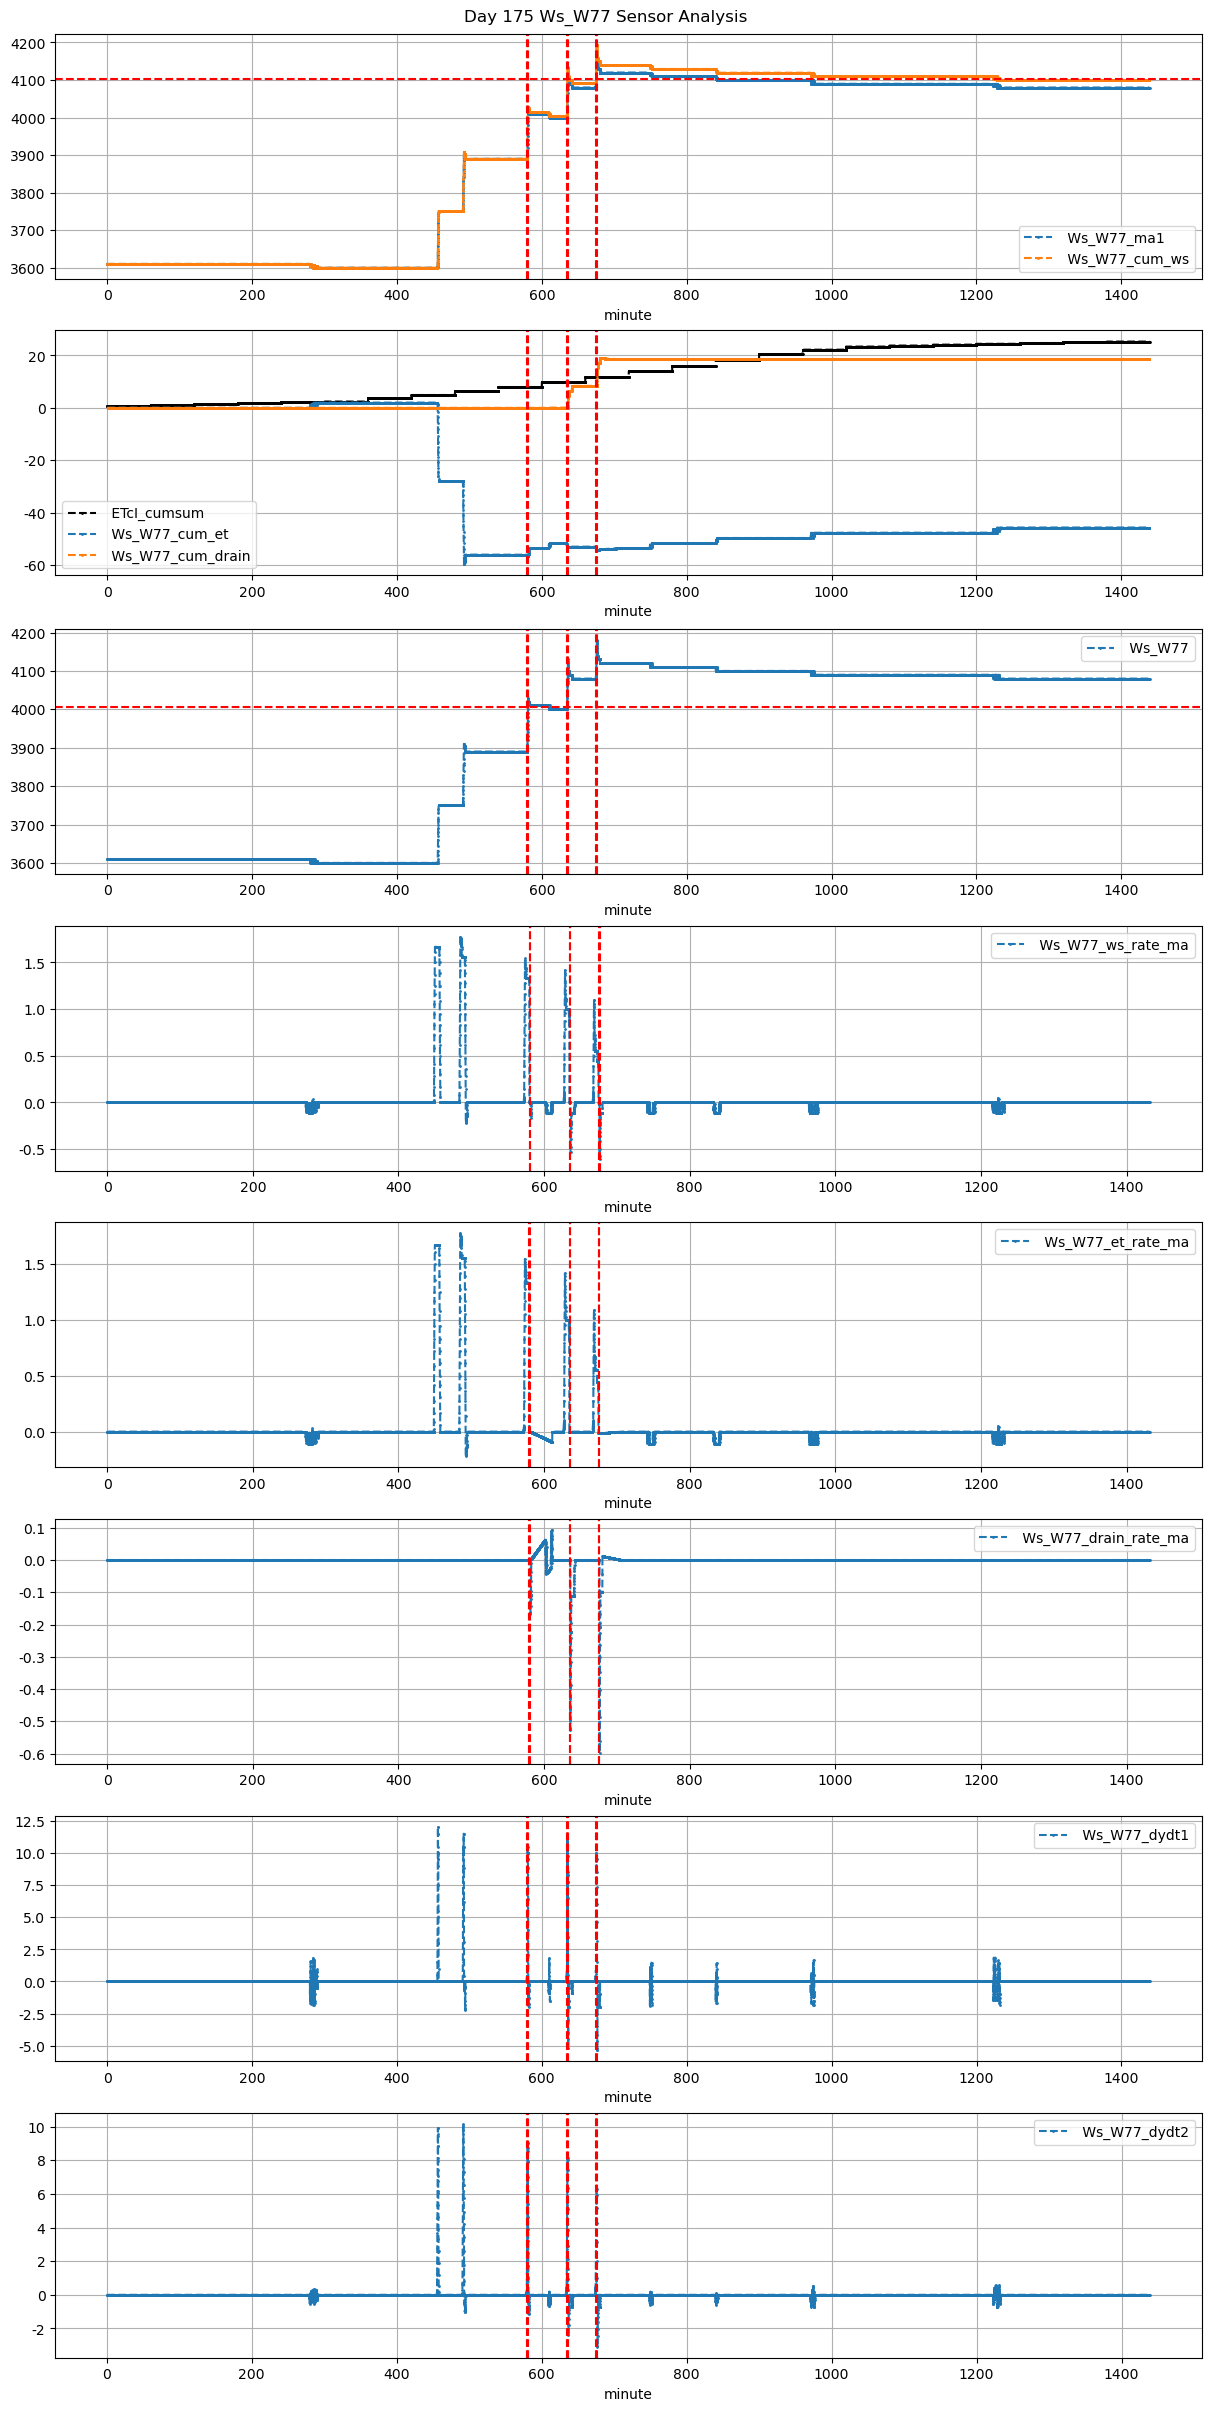
175 |
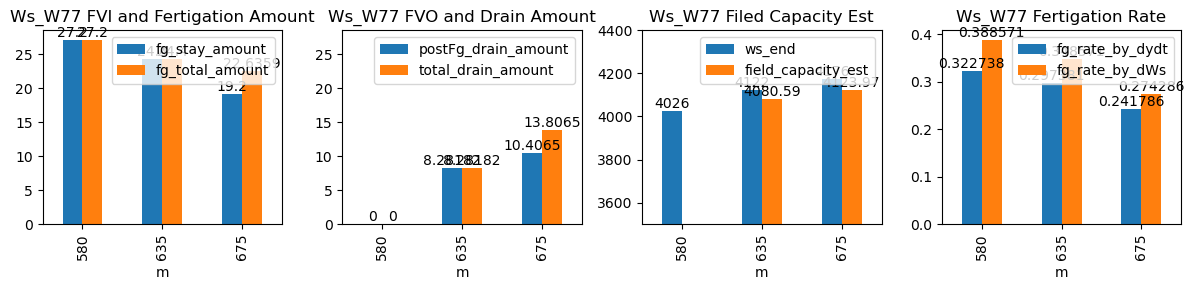
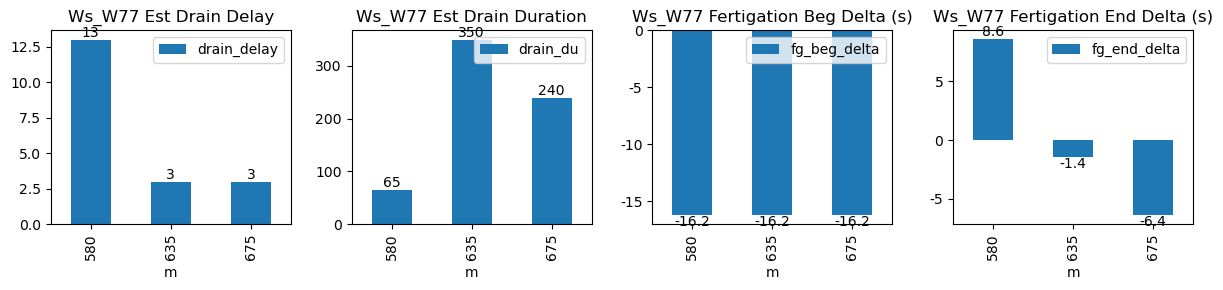
580 |
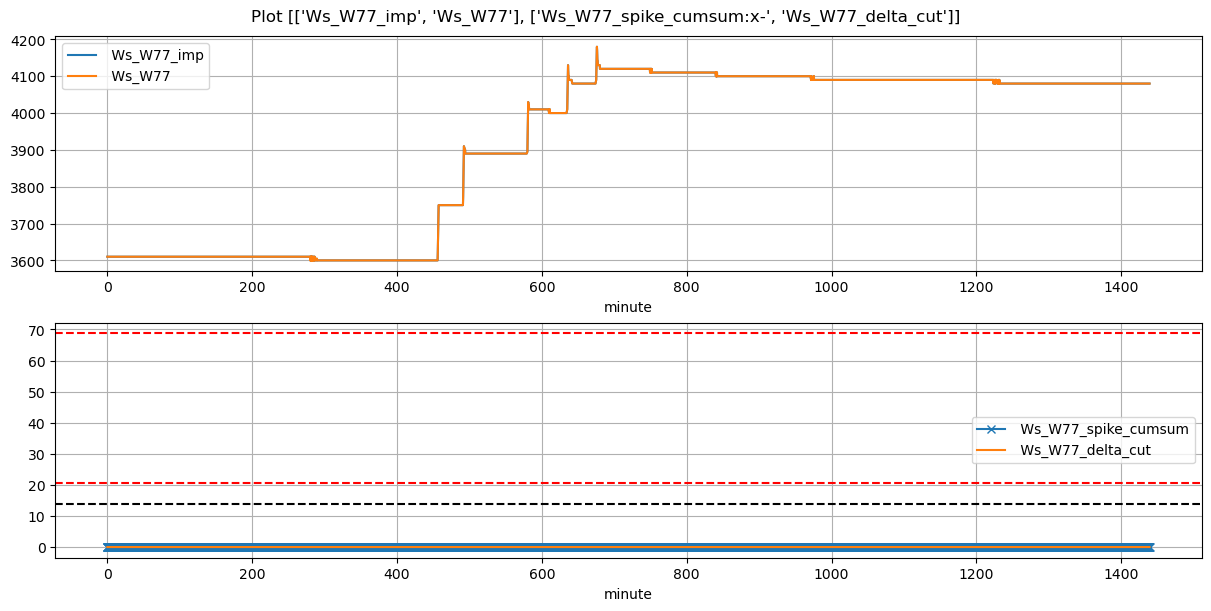
Ws_W77 |
2.299715 |
30 |
580.02 |
579.75 |
581.19 |
581.333333 |
3890.0 |
4026.0 |
70 |
0.000000 |
-0.016790 |
-0.09321 |
0.322738 |
0.388571 |
27.2 |
True |
-16.2 |
8.6 |
27.200000 |
0.0 |
0.000000 |
0.000000 |
65 |
13 |
-0.109644 |
NaN |
| 2026-03-30 10:35:01+08:00 |
175 |
635 |
Ws_W77 |
2.299715 |
30 |
635.02 |
634.75 |
636.19 |
636.166667 |
4000.0 |
4122.0 |
70 |
0.000000 |
-0.104321 |
0.00000 |
0.297381 |
0.348571 |
24.4 |
True |
-16.2 |
-1.4 |
24.400000 |
0.0 |
8.281818 |
8.281818 |
350 |
3 |
-0.298148 |
4080.590909 |
| 2026-03-30 11:15:01+08:00 |
175 |
675 |
Ws_W77 |
2.299715 |
30 |
675.02 |
674.75 |
676.19 |
676.083333 |
4080.0 |
4176.0 |
70 |
-0.013909 |
-0.091564 |
0.00000 |
0.241786 |
0.274286 |
19.2 |
True |
-16.2 |
-6.4 |
22.635929 |
3.4 |
10.406492 |
13.806492 |
240 |
3 |
-0.457054 |
4123.967538 |